
Stay Informed
Follow us on social media accounts to stay up to date with REHVA actualities
|
Livio Mazzarella |
ProfessorPolitecnico di Milano, Italylivio.mazzarella@polimi.it |
In the first part of this paper, published in the April Issue of this Journal, problems related to unclear definitions has been examined, coming out with the conclusion that the aim of the Directive (to have an EU common path to buildings decarbonization) is only partially addressed, because the objective, the new Zero Emission Building, is a bit too strong than what is probably feasible possible, opening the way to a plethora of different national interpretations in its implementation.
But that is not the only consequence of having chosen the total primary energy use as the building performance indicator, as we can see in the followings.
Having assumed that the total primary energy indicator is what EPBD is asking for both compliances with minimum requirements and for the classification in the energy performance certificate (art. 19 clause 2 is specifying that a Class A building shall correspond to the Zero Emission Building (ZEB)), how this primary energy shall be evaluated is still an open question.
By its definition the primary energy use shall be calculated using the delivered (and eventually the exported) energy carriers and the primary energy conversion factors, which are well defined in the EPBD, as total, non-renewable and renewable primary energy factors. In formulas:

with X = Tot, non-Ren, Ren and
![]()
![]()
![]()
and, eventually, only
![]()
It is clear that the denominator must be the full delivered energy carrier regardless of its composition, i.e. how much of 1 kWh grid electricity is provided by a non-renewable energy source and how much by a renewable one (for instance, 50% from non-RES, 50% from RES). There is not any specific standard or official EU document stating the method that shall be used for calculating the primary energy factors of complex systems such as the electric grid. There is only a CEN standard on how to report the way these values have been derived, but the chosen method is upon the user of the standard without any constraint (EN 17423:2020).
How the primary energy conversion factor should be calculated for a simple grid fed by 1 natural gas power plant with a yearly average conversion efficiency of 0.35 and a PV field with a yearly average conversion efficiency of 0.1, if they produce the first 80% and the second 20% of the delivered electricity?
The solar energy used to provide 1 kWh electricity (renewable energy carrier) is 1/ηPV=1/0.1=10 kWh and thus the renewable energy primary conversion factor is
![]()
The natural gas energy used to provide 1 kWh electricity (non-renewable energy carrier) is 1/ηPS=1/0.35=2.875 kWh and thus the non-renewable energy primary conversion factor is:
![]()
N.B.: 1.1 is the primary energy factor for natural gas, which accounts for well-to-power station distribution losses including compression energy use.
But the electricity delivered to the user, assuming no transmission losses, is compounded by 80% electricity from non-RES and 20% from RES, thus the total primary energy conversion factor is:


![]()
and
![]()
![]()
Instead, if we look at the values provide by the Annex B, table B.16, of EN ISO 52000-1:2017, for grid electricity, we found that
![]()
![]()
![]()
It is evident that it was assumed thatF'P,del,Ren;PV,el = 1 and thus

Why? This is because Eurostat statistics, where this ratio is coming from (share of renewables in electricity production) is just looking for the share of electricity produced by renewable energy sources over the whole electrical production. It was not designed to assess the renewable energy used to produce such an amount of electricity, because being renewable there was no reason to do that. Instead, for the non-renewable energy sources the conversion efficiencies are taken into account to assess the amount of oil or gas used. In fact, in the past, the unit of equivalent oil tons was used to report the amount of non-renewable energy used.
This is the reason for which in Annex B, table B.16, of EN ISO 52000-1:2017, you can find:
Delivered from on-site | FP,del,nRen | FP,del,Ren | FP,del,Tot | CO₂ |
Solar PV electricity | 0 | 1 | 1 | 0 |
Thermal | 0 | 1 | 1 | 0 |
Wind | 0 | 1 | 1 | 0 |
Environment Geo-, aero-, hydrothermal | 0 | 1 | 1 | 0 |
This is just explained only by the consideration made before[1] and this wrong approach is introducing a market distortion and is worsening the required “energy efficiency principle first”. In fact, using such primary conversion factors with the assessment boundary defined in the same standard (i.e. the conversion devices are placed out of the assessment boundary, and thus the renewable energy carrier is crossing such boundary and then must be used to calculate the primary energy) (Figure 1. EN ISO boundary), if you have a roof-mounted PV system with an efficiency of 0.01 or 0.1 they will use the same amount of “primary” solar energy! Thus, they have the same primary energy indicator, while the first will use ten times the area of the second wasting the available solar energy potential of 9 m² over 10 m². Really not energy efficient!
The use of the total primary energy thus relays on renewable primary energy conversion factors that are physically inconsistent and that are addressing the design exactly in the wrong direction than is required.
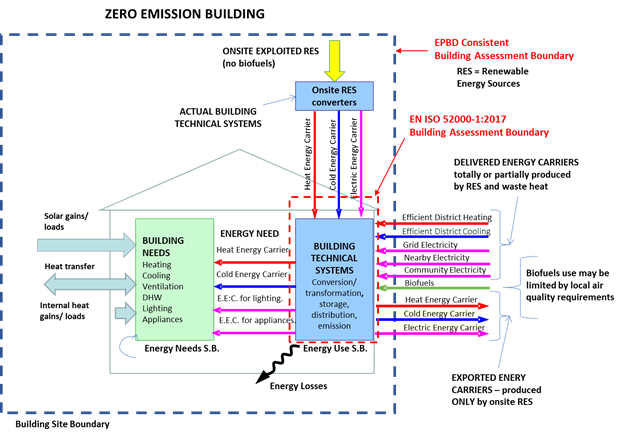
Figure 1. EN ISO 52000-1:2017 and EPBD consistent Building assessment boundaries.
According to the discussion carried out in part one, we assume that the most consistent assessment boundary is the one shown in Figure 1 identified as EPBD consistent boundary, which clearly distinguishes between on-site renewable energy source (RES) exploitation (made by the building systems) and the delivered energy carriers provided by the nearby or far energy system out of the control of the building systems designer.
Thus, assuming that there is no export of PV self-generated PV electricity, and that the system employs an enough large electrical storage to avoid grid electricity use, the primary energy use indicator is simply given by:

where EP is evaluated over one year.
For an existing building, the energy performance certificate (EPC) shall be based on the total primary energy use (art.19). Thus, let to compare two identical buildings in the same place with the only difference in the heat generation system: a natural gas condensing boiler (which shall be phased-out according to each national phase-out plans for fossil fuel boilers) and an electric heat pump, which in turn is fed by electricity from the grid or from an on-site PV system with a yearly average efficiency of 0.1 or 0.2. The building energy need is set to 100 kWh/m² of useful area in a year.
In Table 1 the two different systems are compared using the two different assessment boundaries, the EN ISO 52000-1:2017 standard, and what has been identified in part 1 of this paper and in the following called as EPBD consistent boundary, both shown in Figure 1. According to the previous discussion on the primary energy conversion factor, two different sets are used, those given in Annex B, table B.16, of EN ISO 52000-1:2017, and the physical based referred to the actual primary energy use of a renewable energy source (which account for the conversion efficiencies of the renewable energy converters: PV panel, thermal solar collectors, etc.,). A specific discussion is required for the heat pump that, being an energy transformer, when using the EN ISO assessment boundary has to be thought as a split system having the evaporator out of that boundary while compressor and condenser inside. This results in a primary energy factor of 1 applied to the evaporator extracted energy.
Table 1. Systems comparison using different assessment boundaries and primary energy factors.
Heating System | Gas Boiler | Heat Pump | Heat Pump | Heat Pump | Heat Pump |
Energy carrier | natural gas | grid electricity | PV on-site electricity ηPV irrelevant | PV on-site electricity ηPV=0.1 | PV on-site electricity ηPV=0.2 |
ηavor COPav | 0.9 | 3 | 3 | 3 | 3 |
Source of primary energy factors | EN ISO | EN ISO | EN ISO | Physical | Physical |
fPnonren | 1.1 | 2.3 | 0 | 0 | 0 |
fPren | 0 | 0.2 | 1 | 1/ηPV =10 | 1/ηPV =5 |
ftot | 1.1 | 2.5 | 1 | 1/ηPV =10 | 1/ηPV =5 |
Energy need | 100 | 100 | 100 | 100 | 100 |
Energy use to provide the service | 111 | 33 | 33 | 33 | 33 |
EN ISO 52000-1:2017 assessment boundary | |||||
Ren. Delivered Energy carrier |
|
|
|
|
|
- grid electricity |
| 6.7 |
|
| |
- on-siste PV electricity |
| 33.3 | 33.3 | 33.3 | |
- ambient heat energy carrier |
| 66.7 | 66.7 | 66.7 | 66.7 |
nonRen. Delivered Energy Carrier |
|
|
| ||
- grid electricity |
| 26.7 |
|
| |
- natural gas | 111.1 |
|
|
|
|
Renewable Primary Energy Use | 0.0 | 68.0 | 100.0 | 733.3 | 400.0 |
- to produce electricity |
| 1.3 | 33.3 | 666.7 | 333.3 |
- used ambient heat via e.c. |
| 66.7 | 66.7 | 66.7 | 66.7 |
Non-Ren.Primary Energy Use | 122.2 | 61.3 | 0.0 | 0.0 | 0.0 |
Total Primary Energy Use | 122.2 | 129.3 | 100.0 | 733.3 | 400.0 |
EPBD consistent assessment boundary | |||||
Ren. Delivered Energy carrier |
|
|
|
|
|
- grid electricity |
| 6.7 |
|
| |
- on-site PV electricity |
| 0.0 | 0.0 | 0.0 | |
- ambient heat energy carrier |
| 0.0 | 0.0 | 0.0 | 0.0 |
non-Ren. Delivered Energy Carrier |
|
|
| ||
- grid electricity |
| 26.7 |
|
| |
- natural gas | 111.1 |
|
|
|
|
Renewable Primary Energy Use | 0.0 | 1.3 | 0.0 | 0.0 | 0.0 |
- to produce electricity |
| 1.3 | 0.0 | 0.0 | 0.0 |
- used ambient heat via e.c. |
| 0.0 | 0.0 | 0.0 | 0.0 |
Non-Ren. Primary Energy Use | 122.2 | 61.3 | 0.0 | 0.0 | 0.0 |
Total Primary Energy Use | 122.2 | 62.7 | 0.0 | 0.0 | 0.0 |
Renewable Energy Source Use |
|
|
| ||
-solar from grid | 0.0 | 1.3 |
|
| |
- solar from on-site PV | 0.0 | 33.3 | 666.7 | 333.3 | |
- ambient using HP | 0.0 | 66.7 | 66.7 | 66.7 | |
Total | 0.0 | 1.3 | 100.0 | 733.3 | 400.0 |
CO2 production (Operational GWP) | Nat. gas | Grid elec. | Ren. E.C. | Ren. E.C. | Ren. E.C. |
fCO2 [gCO2,eq/kWh] | 220.0 | 420.0 | 0.0 | 0.0 | 0.0 |
GWP [KgCO2,eq/kWh] | 24.4 | 11.2 | 0.0 | 0.0 | 0.0 |
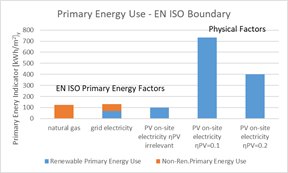
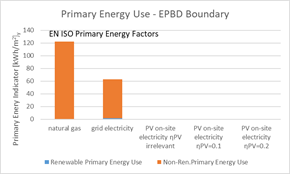
Figure 2. Systems comparison using different assessment boundaries and different primary energy factors: primary energy.
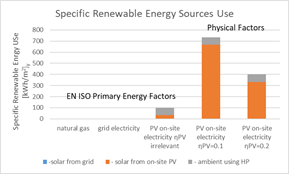
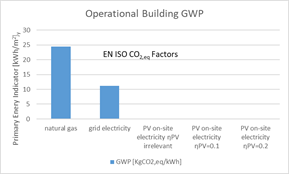
Figure 3. Systems comparison using different primary energy factors: renewable energy source use and GWP.
Looking at the results reported in Table 1, and synthetically shown in Figure 2 and 3, and recalling the fact that the primary energy indicator is calculated on the energy carriers that are crossing the assessment boundary, the following considerations can be done:
· using the EN ISO boundary and primary energy factors, the grid electricity driven heat pump has a bit higher total primary energy use indicator than the natural gas boiler, difference that can only increases if the correct grid electricity renewable primary energy factor is produced and used;
· using the EN ISO boundary and primary energy factors, the on-side PV electricity driven heat pump has a bit lower total primary energy use indicator than the grid driven one and the natural gas boiler;
· using the EN ISO boundary and physical based primary energy factors, the on-side PV electricity driven heat pump has a much higher total primary energy indicator because of the real accounting for the exploitation of the on-site renewable energy sources (solar and ambient), but a strong reduction is shown in moving from lower to higher PV system efficiencies giving a penalty to the worst system, which is not the case using the EN ISO factor than does not depend on the quality of the converter;
· using the EPBD consistent boundary, the grid electricity driven heat pump has a total primary energy use indicator that is about half of that of the natural gas boiler, using the EN ISO primary energy factors, difference that can be reduced if the correct grid electricity renewable primary energy factor is produced and used, and
· using the EPBD consistent boundary, the on-side PV electricity driven heat pump has a null total primary energy indicator (no renewable energy carriers are crossing the assessment boundary as well as non-renewable ones).
One question may arise about the null values of the indicator when using the EPBD consistent assessment boundary with only on-site energy production by on-site RES. In this case, it is not possible to distinguish between different system qualities. This is a common problem with the EN ISO boundary used with the EN ISO primary factors. Therefore, we can either revert to the EN ISO boundary using physically based primary factors, or we can use the EPBD boundary with a second complementary indicator to assess system quality. In this second case, we can use the specific renewable energy source usage (a quantity we already calculate to make the building energy balance), as calculated in Table 1 and shown in Figure 2. Since this is a "politically" new quantity, its numerical values do not matter. During the transition from Nearly Zero Energy buildings to Zero Emission buildings, the total primary energy indicator will be close in value to the non-renewable primary energy indicator mostly used in EPCs before the EPBD recast.
The ZEB requirement to have an operational Global Warming Potential less than a nationally prefixed offset value is closely related to the use of fossil carbon-based non-renewable energy sources, assuming that all carbon-based non-fossils fuels (biomass, biogas) are carbon neutral on their lifetime (from the cradle to the grave, the combustion). Thus, as expected, using the energy carriers-to-equivalent carbon production conversion coefficients, as those reported in EN ISO 52000-1:2017, and considered in Table 1, the operational GWP is straightforward calculated from the non-renewable delivered energy carriers.
Figure 2 shows as the operational GWP, which is exactly the same using either the in EN ISO 52000 assessment boundary or EPBD consistent boundary, is following the same trend of the total primary energy use indicator calculated using the EPBD consistent boundary, even if for the primary energy conversion factors the EN ISO are used.
After this short analysis, starting with the most important definitions, and ending with the comparison of two potential technical framework to be used for the practical application of the Zero Emission Building concept, we can summarize the conclusions as it follows:
· the total primary energy indicator has been selected instead of the non-renewable primary energy indicator probably because of the intension to still have a useful building performance indicator when no non-renewable energy source is anymore used for the building energy needs; but for how it is defined and instrumented by the EN ISO 52000-1, it is not able to do that as shown in the simple comparison we made.
· To avoid amending the directive to solve all underlined inconsistencies, a different assessment boundary has been identified than the EN ISO, which avoids including the on-side renewable energy exploitation and use in the total primary energy indicator, resulting in a lower value and closer to the almost always used non-renewable primary energy indicator; this indicator works well till the system is completely fed only by on-side produced renewable energy carriers.
· To be able to assess the building performance in case autonomous buildings a second indicator can be added (any Member State can add another indicators), which just evaluates the used renewable energy taken from any renewable energy source (quantities already calculated when making the building energy balance), less it is better the building perform; and then a threshold can be set to comply with for limiting the RES potential use in agreement with the principle “energy efficiency first”.
Another option could be to split the problem using two separated indicators, one for the non-renewable primary energy, and the other for the renewable one; but means to ask to an EPBD revision and we do not have such a time anymore. Any other solution can only increase the confusion and the reduce the trust user may still have in the Institutions.
Anyhow, in this article to make it simpler and more understandable, we just avoid tackling the open question of the PV electricity export, which in principle is allowed by the EPBD, but technically makes only sense if an hourly calculation procedure is used to assess the performance, which is not mandatory. The connected “political” key question is if the ability of being a “distributed RES converter”, which feed the grid and, in the smart grid concept, is managed by the grid authority/company, is a building performance or a smart grid or local energy community performance. Should it be included in the EPC, allowing to balance the energy import with this export or be accounted separately being an “engine” of a local energy system? No clear guidance is available up to now. When updating the current set of EPB standards we should address this.
[1] The CEN working group that produced the EN ISO 52000-1, was (as Eurostad did) just focusing on the amount of renewable energy carriers produced by on-site RES, considering not necessary to quantify the RES exploitation (factors all equal to 1), because “renewables” and then infinite. This point was discussed in part 1, recalling that the RES are not depleting but their potential is finite; and we have to preserve their potential for the future generation.
Follow us on social media accounts to stay up to date with REHVA actualities
0