

Stay Informed
Follow us on social media accounts to stay up to date with REHVA actualities
|
|
Eda Köse Murathan | Gülten Manioğlu |
Department of Architecture, Istanbul Technical University, Istanbul, Turkeykoseed17@itu.edu.tr | Department of Architecture, Istanbul Technical University, Istanbul, Turkey |
Collective experience and knowledge about energy efficient residential building applications in the world and Turkey show that climate compatible approaches are an important topic on our agenda. A significant percentage of energy consumption is used for heating and cooling of buildings to achieve indoor thermal comfort conditions. This has become even more important in hot climate regions with the temperatures exceeding seasonal normals and thus increased cooling energy spending. Therefore, to reduce energy consumption in buildings, it is essential to adopt a design compatible with the climate and to take correct passive design decisions about the variables affecting heating and cooling loads [1,2,3]. The building form with a courtyard that allows shades throughout the day is the most commonly used in hot climate regions. The main function of a courtyard is to improve the thermal comfort of a building by affecting the micro-climate around the building. Façades of all zones facing the courtyard remain in shadow at certain times of the day due to the building's form. This can result in different energy consumptions in different zones as a result of self-shading of the building regardless of the orientations of the zones. Another strategy used to achieve thermal comfort conditions indoors in hot climate regions is to create a building envelope with materials that have more thermal mass to take advantage of the time delay of the building envelope. Especially in areas where there is a big difference in daytime and night time temperatures, the high thermal capacity of the opaque component allows a longer time delay to transfer outdoor temperature to indoors while a low transparency ratio minimizes direct solar heat from the windows [4]. Considering all these variables, it is possible to achieve indoor thermal comfort conditions in hot climate regions with minimum energy by taking the right decisions about the building envelope including the building form, orientation of zones, and transparency ratio [5]. When these variables are addressed with a contemporary approach. Phase change materials (PCMs) are recommended as an alternative to the conventional thermal mass concept in reducing heating and cooling energy in buildings and PCMs can increase the thermal performance of the building to which they are applied [6, 7, 8, 9]. In addition to opaque components, measures should also be taken for transparent components for an energy efficient building design with the right design variables. In the light of this information, this study aimed to calculate and evaluate the combined effect of the building form, zone orientation, transparency ratio of the building envelope, and thermal performance of PCMs which can be integrated into the building envelope to identify the right design variable for energy efficient building design. For this purpose, annual heating, cooling, and total energy consumptions for each zone with a different orientation in a building with a courtyard located in a hot climate region were calculated using Energyplus simulation tool and the results were comparatively evaluated.
In this study, different building envelope alternatives were developed to reduce annual heating, cooling, and total energy consumption of the residential building designed for the study. These alternatives were evaluated for the zones with different orientations on the middle floor of a building with a courtyard in Antalya and Diyarbakır which represent hot and humid and hot and dry climate regions respectively in Turkey. Properties that are defined as inputs in the study and implementation procedures are explained below.
In this study, total heat transfer coefficient values recommended for building envelopes in Antalya and Diyarbakır were determined according to the upper limit values in the standard TS 825 "Thermal Insulation Requirements for Buildings” [10]. The residential building used in this study is a theoretical 3-story building model with dimensions of 30 m × 30 m × 9 m with a courtyard with dimensions of 10 m ×10 m × 9 m, developed based on the building with a courtyard model which is commonly used in the traditional architecture of hot regions. The residential building consists of 8 zones (dimensions 10 m × 10 m) with 2 façades with different orientations and positions in the building. In order to understand the effect of orientation on the zones comprising the building, zones with four main orientations were evaluated and analysed for the cities Antalya and Diyarbakır. Additionally, in the study, only zones in the centre on the middle floor which have opposing exterior walls and windows were used to assess the combined effect of the exterior wall, orientation, transparency ratio, and PCM material. The zones in the buildings are named as follows: Zone 1; Z1, Zone 2; Z2, Zone 3; Z3, Zone 4; Z4, Zone 5; Z5, Zone 6; Z6, Zone 7; Z7, Zone 8; Z8, Zone 8; Z8 The building's floor plan and positions of the zones in relation to each other are shown in Figure 1.
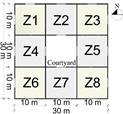
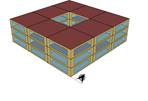
Figure 1. The building's floor plan and positions of the zones in relation to each other.
The transparency ratio on the façades of the residential building was increased incrementally by 10% (TR; 30%, 40%, 50%) to create alternatives for calculations, and the total heat transfer coefficient of the transparent component was set at U=1,5 W/m²K in accordance with the TS825 (Uw:1,8 W/m²K) for both cities. Additionally, solar heat gain coefficient was set at 0.6 and the visible transmittance value was set at 0.7 in the program. Building Envelope Layering Details recommended for Antalya and Diyarbakır according to TS825 are as follows. Within the scope of the study, the recommended U values for the external walls, ground floor, and roof are 0,65 W/m²K, 0,65 W/m²K, 0,398 W/m²K for Antalya, and 0,564 W/m²K, 0,564 W/m²K, 0.379 W/m²K for Diyarbakır.
For both cities; heating needs of the building with round the clock occupancy was met with a natural gas boiler and cooling need was met by an electrical split air conditioning system. Optimum indoor thermal comfort was maintained with a thermostat and this value was 20°C in the heating period and 26°C in the cooling period. Mechanical ventilation was turned on during the day only when the indoor air temperature was higher than the comfort value (26°C) set for the cooling period [8,9]. The infiltration rate of the building was set at ASHRAE Standard 55 0.5 h-1 [11]. The occupancy rate in the residential building was set at 4 people based on statistical data [12]. Furthermore, use of equipment was also entered as input in the simulation depending on their weekly usage rates.
Meteorological data files based on real atmospheric conditions were used in all calculations. For Diyarbakır and Antalya, the weather file created by using the Typical Meteorological Year weather file set provided by the Turkish Meteorology Office was used. According to this weather file, the average annual outdoor air temperature in Diyarbakır is 15.87°C, the maximum outdoor air temperature is 42.3°C and the minimum outdoor air temperature is −8.6°C. The average annual outdoor air temperature in Antalya is 19.11°C, the maximum outdoor air temperature is 41.7°C and the minimum outdoor air temperature is 1.1°C.
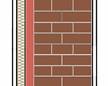
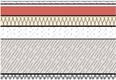
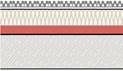
PCMs work with thermal mass principle in architecture and absorb heat and stores in the building component on which they are applied; delay the effects of outdoor climatic elements and decrease their decrement factor to transfer to indoors. The difference between indoor and outdoor temperatures should be small to balance indoor comfort for PCMs to have an effective role in buildings as a passive strategy [6,7,8,9,10,11]. Based on this information, SP26E [13] model PCM recommended for hot climates by PCM companies was chosen both for Antalya and Diyarbakır in the study. The thermophysical properties of PCM are as follows: latent heat (LH); 18,000 J/kg, sensible heat (c); 2,000 J/kg-K, melting temperature (°C); 26°C, Conductivity (λ); 0.9 W/mK, Density (ρ); 1,500 Kg/m³. In this study, PCM was considered as a separate layer like other materials. In addition, "Finite differences calculation method" was chosen as the calculation algorithm to correctly simulate thermal transfer during the phase change process [7,14]. Previous studies have found that the best performance was achieved when PCMs with a thickness of 5 cm are applied on the inner side of the insulation material [8,9]. Therefore, this study used PCM with 5 cm thickness on the building envelope and its position on the building envelope layers is shown in Table 1.
Table 1. Position of PCM in the Building Envelope Layers.
# | Exterior Wall | Ground Floor | Roof |
|
|
| |
U (W/m² K) | U (W/m² K) | U (W/m² K) | |
Antalya | 0.638 | 0.644 | 0.393 |
Diyarbakır | 0.546 | 0.551 | 0.372 |
| |||
Thermal performance of the building envelope was evaluated by applying the PCM shown in Table 1 on the residential building and by gradually increasing transparency ratios (30%, 40%, 50%). Calculations were done for both cities with Energyplus simulation tool and then analysed. The findings of the calculations done in the study are shown in the following sections.
Comparative evaluations were done using the alternatives where PCM was applied and alternatives where PCM was not applied on the building envelope to evaluate the effects of variables including the building form, orientation of zones, and transparency ratios of the building envelope as well as PCM. Energy consumptions in the zones with different orientations were calculated for the alternative in which PCM was not applied on the building envelope (with no PCM), using 30%, 40%, and 50% transparency ratios respectively. Then the calculations were repeated by applying PCM on the building envelope (with PCM) and the combined effects of calculation variables on the zones were evaluated. Findings, where differences in energy consumptions were observed between zones, are shown in Figure 2 for Antalya and Diyarbakır. Differences in annual heating, cooling, and total energy consumptions of the zones selected in Antalya and Diyarbakır in the alternative with no PCM were shown in percentages in Tables 2 and 3.
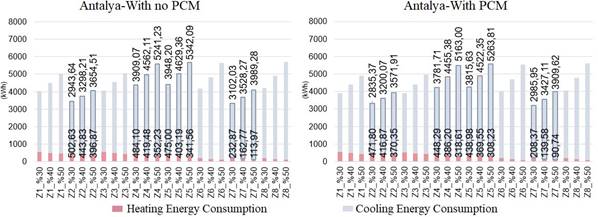
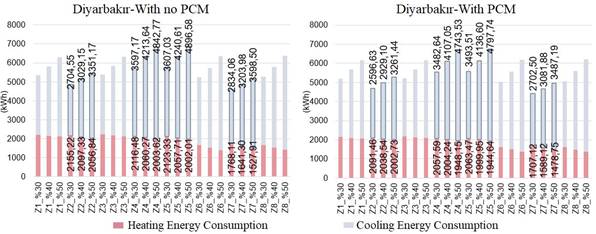
Figure 2. Differences in energy consumptions of the zones in Antalya.
Table 2. Decrease in energy consumption in the zones selected in Antalya compared to the alternative with no PCM (%).
Zone | Z2 | Z4 | Z5 | Z7 | |||||||||
SO | 30% | 40% | 50% | 30% | 40% | 50% | 30% | 40% | 50% | 30% | 40% | 50% | |
Antalya | Heating | 6.13 | 6.07 | 6.68 | 7.40 | 7.93 | 9.55 | 7.58 | 8.34 | 9.76 | 10.52 | 14.24 | 20.39 |
Cooling | 3.68 | 2.98 | 2.26 | 3.26 | 2.34 | 1.49 | 3.36 | 2.31 | 1.47 | 3.74 | 2.87 | 2.00 | |
Total | 4.04 | 3.34 | 2.69 | 3.71 | 2.81 | 2.00 | 3.81 | 2.79 | 1.96 | 4.22 | 3.37 | 2.51 | |
Differences in energy consumptions in the zones selected in Antalya were evaluated compared to the alternative in which PCM was not applied on the building envelope (with no PCM). When the transparency ratio changed to 30%, 40%, 50%: The lowest heating energy consumption was achieved in zone Z7 with south orientation which has the highest solar heat gain. In this zone with the use of PCM, heating energy consumption decreased by 10.52%, 14.24%, and 20.39% respectively, and cooling energy consumption decreased by 3.74%, 2.87%, and 2% respectively.The highest heating energy consumption was in zone Z2 with north orientation, which has the lowest solar heat gain. In this zone with the use of PCM, heating emery consumption decreased by 6.13%, 6.07%, and 6.68% respectively. Zone Z2 is also the zone with the lowest cooling energy consumption. Cooling energy consumption decreased by 3.68%, 2.98%, and 2.26% respectively when PCM was used.When zones Z4 and Z5 on the east and west façades of the building were evaluated, heating energy consumption was higher in zone Z4, and cooling energy consumption was higher in zone Z5 (Table 2). Total energy consumption with the combined effect of calculation variables was the highest in zone Z5 with east orientation and total energy consumption decreased by 3.81%, 2.79%, and 1.96% when PCM was applied. The zone with the lowest total energy consumption changes depending on the transparency ratio. The lowest total energy consumption was in zone Z7 with transparency ratios 30% and 40%, whereas the lowest total energy consumption was achieved in zone Z2 with a transparency ratio of 50%. With PCM use, total energy consumption decreased by 4.22, 3.37%, and 2.51% respectively in zone Z7 and by 4.04%, 3.34%, and 2.69% respectively in zone Z2.
Table 3. Decrease in energy consumption in the zones selected in Diyarbakır compared to the alternative with no PCM (%).
Zone | Z2 | Z4 | Z5 | Z7 | |||||||||
SO | 30% | 40% | 50% | 30% | 40% | 50% | 30% | 40% | 50% | 30% | 40% | 50% | |
Diyarbakır | Heating | 2.96 | 2.80 | 2.63 | 2.78 | 2.72 | 2.77 | 2.82 | 2.81 | 2.87 | 3.45 | 3.18 | 3.22 |
Cooling | 3.99 | 3.30 | 2.68 | 3.18 | 2.53 | 2.05 | 3.15 | 2.45 | 2.02 | 4.64 | 3.81 | 3.09 | |
Total | 3.53 | 3.10 | 2.66 | 3.04 | 2.59 | 2.26 | 3.03 | 2.57 | 2.26 | 4.18 | 3.60 | 3.13 | |
Differences in energy consumption in the zones selected in Diyarbakır were evaluated compared to the alternative in which PCM was not applied on the building envelope (with no PCM). When the transparency ratio changed to 30%, 40%, 50%: The lowest heating energy consumption was achieved in zone Z7 with south orientation, which has the highest solar heat gain. In this zone with the use of PCM, heating energy consumption decreased by 3.45%, 3.18% and 3.22% respectively and the cooling energy consumption decreased by 3.45%, 3.18%, and 3.21% respectively. The highest heating energy consumption was in zone Z2 with north orientation, which has the lowest solar heat gain. In this zone with the use of PCM, heating energy consumption decreased by 2.96%, 2.80%, and 2.63% respectively. Zone Z2 is also the zone with the lowest cooling energy consumption. Cooling energy consumption decreased by 3.99%, 3.30%, and 2.68% when PCM was used.When zones Z4 and Z5 on the east and west façades of the building were evaluated for heating energy consumption, heating energy consumption was higher in zone Z4 compared to zone Z5 (Table 3). When these zones were evaluated for cooling energy consumption, cooling energy consumption was higher in zone Z5 compared to zone Z4. Zone Z5 on the east façade of the building had the highest cooling energy consumption, and cooling energy consumption decreased by 3.15%, 2.45%, and 2.02% respectively. Cooling energy consumption decreased by 3.18%, 2.53%, and 2.05% in zone Z4 on the west façade.Total energy consumption with the combined effect of calculation variables was the highest in zone Z5 with east orientation and total energy consumption decreased by 3.81%, 2.79%, and 1.96% respectively depending on the transparency ratio when PCM was applied. The total energy consumption was the lowest in zone Z2 and decreased by 3.53%, 3.10%, and 2.66% respectively depending on the transparency ratio when PCM was applied.
The study performed a simulation-based comparative evaluation of the combined effects of passive design strategies including building form, zone orientation, transparency ratio of the building envelope and PCM application on the building envelope. The findings of the study are summarized below.
Cooling energy consumption decreased by between 6.07% and 20.39% in the zones in Antalya and decreased by between 2.63% and 3.45% in Diyarbakır compared to the alternative with no PCM. Cooling energy consumption decreased by between 1.46% and 3.74% in Antalya and decreased by between 2.05% and 3.99% in Diyarbakır. The biggest change in terms of decrease in heating energy consumption was in zone Z7 in Antalya and Diyarbakır compared to the alternative with no PCM. Heating energy consumption decreased by between 10.52%-%20.39 in Antalya and 3.45%-3.22% in Diyarbakır compared to the alternative with no PCM. Although both Antalya and Diyarbakır are both in hot climate regions, they are indifferent degree day regions according to TS825. Minimum total heat transfer coefficient values required according to the standard TS825 are also different. This resulted in PCMs being more effective and acting like insulation materials to reduce heating loads in Antalya. This insulation effect in Diyarbakır was observed less due to the reason that the building envelope was designed with a higher total heat transfer coefficient in the first step of the study. Since outdoor air temperature is higher in Antalya than Diyarbakır during heating period, the difference between indoor and outdoor temperatures is small and therefore PCM was found to be more effective. Since outdoor temperature values are similar in the cooling period, PCM's effect on energy consumption was similar. Zones Z7 and Z2 have both south and north façades as a result of the building having a courtyard. However, since zone Z7 was not in the shadow of any zone and achieved maximum solar heat gain in the south, the heating energy consumption of zone Z7 was lower than Z2 but cooling energy consumption was higher. Solar heat gain was similar in zone Z4 with west orientation and zone Z5 with east orientation was similar and as a result, they had similar cooling and heating energy consumption. When the building form had self-shading, PCM was less effective in the preservation of heating energy. This shows that although PCM application on building envelope provides improvement, no gain might be obtained due to the position of the zone and therefore the right decisions about the position of the zones in the building should be taken during the design stage. The south façade of zone Z2 is in shade in most part of the day due to the building having a courtyard and the north façade can have a very little amount of solar heat gain throughout the year. Therefore, the zone with the lowest cooling energy consumption was zone Z2 in Antalya and Diyarbakır. The zone with the highest heating energy consumption differed and became Z7 for Antalya and zone Z5 for Diyarbakır. The highest total energy consumption was in zone Z5 for both cities. The lowest total energy consumption was in zone Z2 with all transparency ratio options and in zone Z7 with 30% and 40% transparency ratio alternatives and in zone Z2 with 50% transparency ratio alternative in Antalya.
This study shows that one variable alone cannot be effective in reducing energy consumption in buildings, that some variables may have negative effects depending on the conditions and that combined effects of variables should always be used. Therefore, future studies can investigate in more detail thermal behaviour of PCMs by analysing heat transfer during phase change together with energy efficient design strategies. Thus, PCMs are expected to be used more in buildings considering their benefits when they are used with the right design decisions.
1] Z. Yılmaz. 2007. Evaluation of energy efficient design strategies for different climatic zones: comparison of thermal performance of buildings in temperate-humid and hot-dry climate, Energy Build., 39 (3), 306-316, https://doi.org/10.1016/j.enbuild.2006.08.004.
[2] Manioğlu, G., Oral, Koçlar, G. 2010. Ekolojik yaklaşımda iklimle dengeli tasarım, 5. Ulusal Çatı&Cephe Sempozyumu, İzmir.
[3] Erhorn, H., Mroz, T., Morck, O. et al. 2008. The energy concept adviser-a tool to improve energy efficiency in educational buildings, Energy and Buildings, Vol. 40(4), pp. 419-428.
[4] Holman, J.P, 1976. Heat Transfer, McGraw-Hill Education Publisher, 512 pages.
[5] Manioğlu, G.,Koçlar Oral, G. 2012. Evaluation of domestic dwellings in hot and dry region of Turkey concerning thermal comfort and energy efficiency, International Building Physics Conference, Kyoto/Japonya, p. 839-846.
[6] Lei, J., Yang, J., Yang, E.-H., 2016. Energy performance of building envelopes integrated with phase change materials for cooling load reduction in tropical Singapore. Appl. Energy 162, 207–217.
[7] Murathan, K. E., Manioğlu, G. 2020. Evaluation of phase change materials used in building components for conservation of energy in buildings in hot dry climatic regions, Renewable Energy, https://doi.org/10.1016/j.renene.2020.09.086.
[8] Y. Cui, J. Xie, J. Liu, J. Wang, S. Chen. 2017. A review on phase change material application in building, Adv. Mech. Eng. 9 (6), 1-15, https://doi.org/10.1177/1687814017700828.
[9] Soares, N., Reinhart, F., Hajiah, A. 2017. Simulation-based analysis of the use of PCM-wallboards to reduce cooling energy demand and peak-loads in low-rise residential heavyweight buildings in Kuwait, Building Simulation 10 (4), 481-495, https://doi.org/10.1007/s12273-017-0347-2.
[10] Turkish Standards Institution, TS825: Thermal Insulation Requirements for Buildings, 2013. Ankara.
[11] ASHRAE Standard 55. 2017. Thermal Environmental Conditions for Human Occupancy, Atlanta, USA.
[12] Turkish Statistical Institute, TUIK, Population and Housing Research Report, 2017, p. 27597. Issue.
[13] Rubitherm Technologies GmbH; 2016<https://www.rubitherm.eu>.
[14] U.S. Department of Energy. Input Output Reference. EnergyPlus™ Version 9.0.1 Documentation, pp. 139.
Follow us on social media accounts to stay up to date with REHVA actualities
0