


Stay Informed
Follow us on social media accounts to stay up to date with REHVA actualities
|
|
|
Mathilde Ruud | Mona Skar Baglo | Andreas Undheim Øgreid |
studentNorwegian University of Science and Technology | studentNorwegian University of Science and Technology | studentNorwegian University of Science and Technology |
|
|
|
Ivan Vu | Kari Thorset Lervik | Guangyu Cao |
studentNorwegian University of Science and Technology | studentNorwegian University of Science and Technology | Dr. (Sc.), ProfessorDepartment of Energy and Process EngineeringNorwegian University of Science and TechnologyCorresponding author email: guangyu.cao@ntnu.no |
In this field study, lecture room S2 at NTNU Gløshaugen, where a real COVID-19 infected student was present during a two-hour lecture, was investigated to calculate the probability of infection risk. The ventilation system in S2 is mechanical balanced ventilation. The results show that the probability of getting infected in S2 with one infected student is 0.098%, which is significantly lower than other studies. The result is in line with the fact that no other students were infected after attending the lecture in S2.
Students spend a lot of time in lecture rooms, where they are closely seated and there is a great risk of infection during the COVID-19 pandemic. Viruses can be transmitted in three different ways: through direct contact, droplet transmission or airborne transmission. In the beginning of the pandemic, it was assumed that the virus could not transmit through air, however current research show there is a high possibility that this is the case [1]. It is assumed in this study that the coronavirus is in fact an airborne disease. A well-functioning ventilation system can decrease the possibility to get infected by an airborne virus, such as the coronavirus.
Previous studies have shown that too high or too low relative humidity is favourable for the survival of the coronavirus, especially for very low relative humidity. The optimal range for relative humidity and human health is 40–60% [2]. According to the University of Sydney [3], relative humidity and infected covid-19 cases have a negative correlation. They found that a 1% decrease in the relative humidity causes a 6–7% increase in infected cases. In addition, ventilation plays a key role to control the indoor air quality. Norwegian building regulation TEK17 states that ventilation rates for people with a light activity level should be minimum 26 m³/h per person [4]. While as for ventilation for building materials, it varies in the range of 2.5–7.2 m³/h per m² floor area according to the emitting materials [5].
Few studies regarding the infection risk have been done in lecture halls with mechanical ventilation. The objective of this article is to quantify the probability of infection of COVID-19 in a large lecture hall with mechanical ventilation at NTNU.
The Wells-Riley equation can approximate the probability of infection due to human exposure to airborne infectious contaminants [6]. The equation is:
![]()
· q– breathing rate per person [![]() ]
]
· I– number of infectors [-]
· p –
quanta per hours produced by infector [![]() ]
]
· t – time of exposure [h]
· Q –
outdoor air supply rate [![]() ]
]
When non-steady state, the CO₂ concentration per time unit can be expressed as:

This change must equal the CO₂ in the supplied air, the production of CO₂ in the room, minus the CO₂ removed by the extracted air. In this case infiltration, exfiltration and the effect of the filters in the air handling unit is neglected. The following expression for the change in CO₂ level is then obtained.
![]()
Combining and rearranging the two equations give:

· ![]() –
ventilation rate
–
ventilation rate ![]()
·
![]() – average
exhaust concentration
– average
exhaust concentration ![]()
·
![]() – average
supply air concentration
– average
supply air concentration ![]()
· ![]() – average source strength of pollutant
– average source strength of pollutant ![]()
· ![]() – volume of room
– volume of room ![]()
· ![]() – change in
CO₂ concentration over time
– change in
CO₂ concentration over time ![]()
On September 24th, a student who was infected with the Covid-19 virus attended a lecture in S2 at NTNU Gløshaugen. There is assumed a total of 131 students present at the lecture, and no other students were infected after attending the lecture in S2 [7].
S2 is a large lecture room at NTNU in Trondheim. The volume of the room is 992.1 m³ and the area is 251.5 m² (see Figure 1). The capacity of the room is 256, but during the pandemic it is reduced to 131 due to infection control measurements. The activity level during a lecture is normally sedentary activity, according to NS-EN ISO 7730:2005.
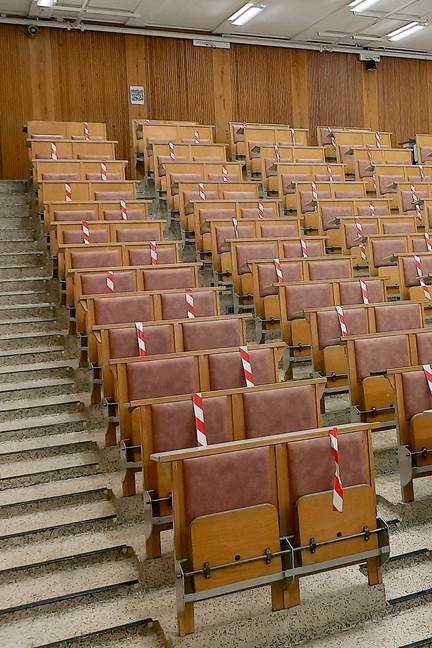
Figure 1. Lecture room S2.
Measurements of CO₂, relative humidity and air temperature were carried out in S2 by the extract shown in Figure 2. The measurements and the occupancy level were manually recorded every minute for one hour.
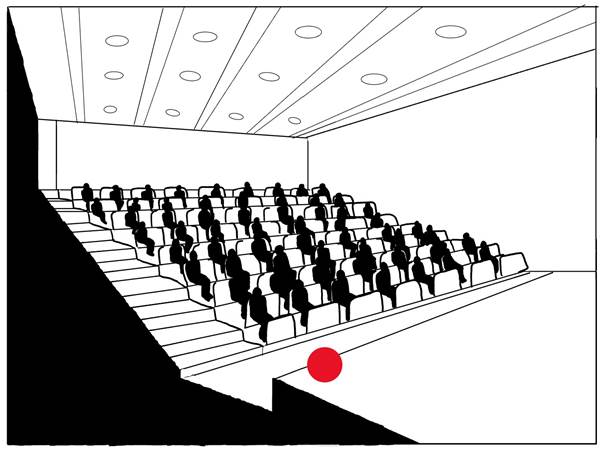
Figure 2. Measurement point in S2.
The results are presented in Figure 3.a, 3.b and 3.c that show CO₂ (ppm), temperature (°C) and relative humidity (%) in relation to the amount of people in the room.
In Figure 3.a the variation in CO₂ level is presented. The number of people is constant during the lecture, but at the end there is a drastic reduction. The CO₂ level varies between 600 and 650 ppm when the amount of people is constant. When the students leave the lecture, the CO₂ concentration first increase followed by a drastic decrease. In Figure 3.b the temperature variations are presented. It is clear that when the amount of people in the room is constant, the temperature increases. At the end of the lecture when people leave the room, the temperature decreases. Figure 3.c presents the variation in relative humidity. During the measurements, the relative humidity varies between 36% and 42%. The relative humidity throughout the lecture is at a moderate level, according to Ahlawat [2], and this will be favourable for a shorter survival time for the virus. With the known information that no one else got infected, the statement about moderate relative humidity throughout the lecture holds.
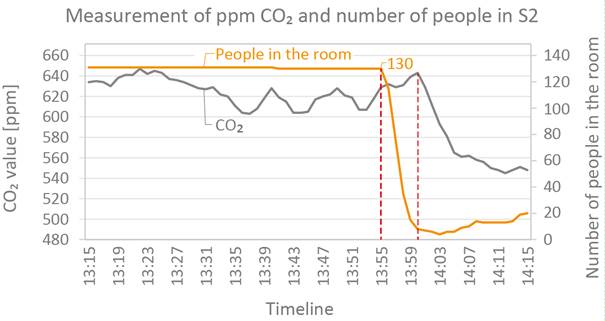
Figure 3.a. Measurements of CO₂ and number of people in the room.
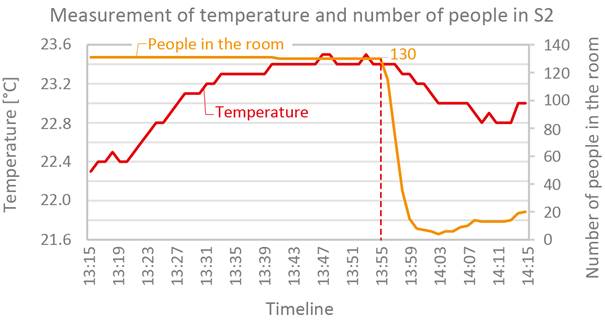
Figure 3.b. Measurements of temperature and number of people in the room.
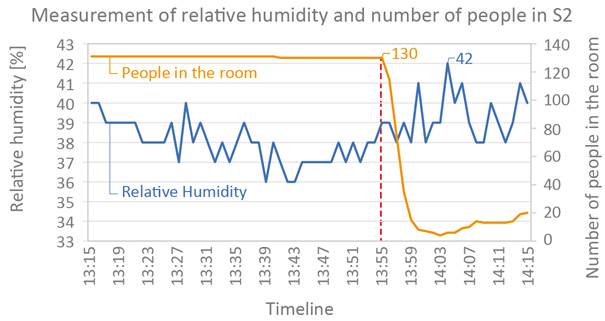
Figure 3.c. Measurements of relative humidity and number of people in the room.
The probability to get infected may be affected by the ventilation rate. To calculate the ventilation rate, the non-steady state equation and the results from the measurements are used. An individual ventilation rate is calculated for each time interval, and the average is used as the final value. The total ventilation rate is calculated to be 5 054.4 m³/h, which is equals to 5.1 h⁻¹ air exchange rate. During the COVID-19 pandemic with the presence of 131 students, the airflow rate is equal to 38.6 m³/h per person or 10.7 ℓ/s per person.
If the variation of the CO₂ concentration becomes zero under steady state conditions, we may assume the room air is fully mixed with supply air. Consequently, the exhaust concentration may be equal to the room CO₂ concentration. The room CO₂ concentration is calculated to be 866.5 ppm under fully mixed steady state condition. The measured value was between 600 and 650 ppm, which is lower than the calculated value.
The Wells-Riley equation is used to calculate the probability of infection in S2. The input variables are gathered from [8]. The number of infected persons is set to 1, the breathing rate is normal at 0.54 m³/h, the quanta per hour of infectious particles from the infected person is set to 4.6 for a classroom, the time of exposure is 2 hours, and the supply air rate has been calculated earlier.
From the required TEK17 value of supply rate, the probability of infection in S2 is calculated to be 0.095%. From the measured value of supply airflow rate, the probability of infection in S2 is calculated to be 0.098%. This shows that the probability to get infected is very low, which is consistent with the known information that no one else got infected after attending the lecture.
However, the Wells-Riley equation does not consider the type of ventilation system or the air flow pattern, only the ventilation rate. The air flow distribution in the room is unknown, and therefore the expected probability to get infected may be greater than the calculated value.
During the COVID-19 pandemic with the presence of 131 students, the supply airflow rate in S2 was equal to 38.6 m³/h per person or 10.7 ℓ/s per person. By using the Wells Riley equation and the measured CO₂ concentration of indoor air, the probability of infection in S2 is calculated to be 0.098%. The result is in line with the fact that no other students were infected after attending the lecture in S2. In addition, this study supports the calculation by REHVA COVID 19 tool that the probability of infection is very low in a larger space with sufficient supply airflow rate.
The calculated fully mixed concentration of CO₂ is significantly higher than the measured value close to the air extraction point. This means that there are possible stagnant zones in S2, where air stays for a longer time with increased risk of occupants inhaling each other's exhaled air.
Further study may be carried out to clarify the airflow pattern and identify potential improvement of IAQ by other type of airflow distribution solutions. To make the analysis even better, an increased number of measurement points would have been ideal.
[1] FHI. Facts about the Covid-19 outbreak. 2020; Online: 27. Oktober 2020. Available from: https://www.fhi.no/en/op/novel-coronavirus-facts-advice/facts-and-knowledge-about-covid-19/fakta-om-covid-19-utbruddet/.
[2] Ahlawat, A., Wiedensohler, A. and Mishra, S.K. (2020). An Overview on the Role of Relative Humidity in Airborne Transmission of SARS-CoV-2 in Indoor Environments. Aerosol Air Qual. Res. 20: 1856–1861. https://doi.org/10.4209/aaqr.2020.06.0302.
[3] Science daily. Low humidity increases COVID-19 risk: Another reason to wear a mask. 2020; Online: 11.01.21. Available from: https://www.sciencedaily.com/releases/2020/08/200818094028.htm.
[4] Direktoratet for byggkvalitet. Byggteknisk forskrift (TEK17). 2017; Online: 15. October 2020. Available from: https://dibk.no/byggereglene/byggteknisk-forskrift-tek17/.
[5] The Norwegian Labor Inspection Authority. Klima og luftkvalitet på arbeidsplassen. 2016; Online: 15.oktober 2020. Available from: https://www.tbk-as.no/wp-content/uploads/2013/04/Veiledning-444-Klima-og-luftkvalitet-p%C3%A5-arbeidsplassen.pdf.
[6] To GNS, Chao CYH. Review and comparison between the Wells–Riley and dose-response approaches to risk assessment of infectious respiratory diseases. 2009; Online: 27.Oktober 2020. Available from: https://www.ncbi.nlm.nih.gov/pmc/articles/PMC7202094/.
[7] Rian Hanger, Mari. Ingen fikk smitten på campus. 2020. Online: 28. Oktober 2020.Available from: https://www.universitetsavisa.no/koronavirus/ingen-fikk-smitten-pa-campus/101413.
[8] Kurnitski, Jarek. Ventilation rate and room size effects on infection risk of COVID-19. 2021; Online: 11.01.21. Available from: https://www.rehva.eu/rehva-journal/chapter/ventilation-rate-and-room-size-effects-on-infection-risk-of-covid-19.
Follow us on social media accounts to stay up to date with REHVA actualities
0