


Stay Informed
Follow us on social media accounts to stay up to date with REHVA actualities
|
|
|
|
Arlind Dervishaj | Glen Dervishaj | Kjartan Gudmundsson | Folke Björk |
KTH Royal Institute of Technology, Stockholm, Swedenarlindd@kth.se | Polytechnic University of Turin, Turin, Italy | KTH Royal Institute of Technology, Stockholm, Sweden | KTH Royal Institute of Technology, Stockholm, Sweden |
This paper investigates novel computational methods for Regenerative Design by developing further on the European Standard EN 17037, to make it useful at both urban and architectural scales. Case studies are evaluated for sunlight provision, daylight design and view quality. A comprehensive assessment of climate-based daylight metrics and EN 17037 methods, for an office building in Helsinki, for a 300 lux target, demonstrates comparable differences of 12% between sDA and Illuminance levels (EN 17037 method 2), 37% between sDA and Daylight Factor (EN 17037 method 1), and 25% between EN 17037 daylight methods 1 and 2. A new computational method for evaluating Views on the floorplan is introduced. The method considers ‘view content’ (View Out layers in EN 17037), ‘view access’, the potential viewpoint-based ‘outside distance’, and can be extended to consider the ‘quality of environmental information’ of views. Integrating computational methods and further research directions are discussed for sunlight, daylight, and view quality as a spatial metric (percentage of space).
Even though Regenerative Design has been introduced as a separate discipline in 1994 by John Tillman Lyle (Mang & Reed, 2013), it is still an emerging field with a growing number of proponents in research and practice. Sustainability practice as it is applied today has focused primarily on reducing environmental impacts on natural systems, and increasing efficiency in the use of resources and processes. The Regenerative Sustainability paradigm aims to shift from the slow degeneration of the planetary boundaries, toward restoring earth’s systems to a healthy state and supporting the co-evolution of human and natural systems (Cole, 2012). A Regenerative Design and Development approach aims to provide for human health and well-being, improve the environmental performance of buildings and restore natural systems to a healthy state. New ways of thinking and a holistic approach required in architectural design can be supported with digital technologies.
In industrialized nations, individuals spend on average 65-90% of their time indoors (Klepeis et al., 2001). Daylight is an important aspect of design for building performance and occupant well-being. The role of daylight in research and practice is growing. New evidence and daylight metrics are continuously updated in some codes and voluntary standards such as LEED v4.1 (USGBC, 2021), WELL v2 (IWBI, 2022) and EN 17037 (European Committee for Standardization [CEN], 2022). The contribution of Daylight for Regeneration Design, in research and digital practice for the built environment, is being explored nowaday with a fresh perspective in contributions that investigate the possibilities when bridging research, design process, and simulations with computational tools (Naboni & Havinga, 2019).
The daylight factor (DF) has been introduced in 1895 as means to quantify the interior levels of daylight independently from the instantaneous sky luminance (Love, 1992). It is still widely used in some building regulations in European countries such as Norway, Sweden and Italy. In Italian, Finnish, Danish, and Swedish regulations, the window-to-floor ratio is used. Alternatively, the DF calculation can be done, and there are several methods of evaluation of it i.e., DF point, mean DF, and median DF. An average daylight factor (ADF) value of 2% is to be met in the case of Norway and Italy. However, ADF results can be misleading when comparing single and multi-aspect window spaces (Mardaljevic & Christoffersen, 2017). In such cases, the median DF is more informative for the daylight of a space. Additionally, the simulated 300 lux Daylight Autonomy (DA) for 50% of occupied hours was found to have a better correlation in student assessments for the boundaries of what is considered a ‘daylit area’ compared to the ‘window-to-head-height’ rule of thumb, or the 2% DF contour lines (C. F. Reinhart & Weissman, 2012).
The motivations and methodology, to transition from ADF to a target DF, determined by the interior daylight provision level, and derived from daylight availability in climate files, as well as to refine the methods and reduce misinterpretation, are explained in detail in a paper prior to the publication of EN 17037 (Mardaljevic & Christoffersen, 2017). The European standard EN 17037:2018 “Daylight in buildings” provides comprehensive methods for the evaluation of daylight properties in buildings. It introduces the Daylight Glare Probability, Sunlight provision based on exposure of windows to sun hours, and a framework for evaluating Views to the outside. Each area of assessment has three levels of recommendation. The Daylight Factor in the EN 17037 is introduced as a provisional method towards the adoption of the second method of the standard using annual Illuminances of weather files based on actual daylight hours. Currently, LEED and WELL standards require Climate Based Daylight Modelling (CBDM) metrics for daylight assessment. BREEAM evaluations are based on the ADF by latitude (BRE, 2021).
The evaluation methods of Sunlight and View Out in EN 17037 can be carried out on paper. It can be time-consuming and require a lot of skill to evaluate. Computation, 3D models, and visual programming in design tools can be used to explore how to perform analysis and carry out geometrical calculations. A computational approach can provide new insight and clarity on new methods and use cases. Additionally, the new methodologies for daylight provision in EN 17037 raise the question of how to carry out, and what are the differences between the two daylight methods, and other existing daylight metrics. Past research provides some answers in assessing EN 17037 methods for compliance, where DF resulted in being harder to meet compared to CBDM (Bournas, 2020). Another paper investigates the use of EN 17037 as a restriction for density in residential developments (Šprah & Košir, 2020). Additionally, case studies need to be investigated to gain an in-depth understanding of daylight conditions, quantify differences and make qualitative comparisons of metrics.
Novel computational methods are investigated through Grasshopper for Rhino (Robert McNeel & Associates, 2020), on basis of EN 17037 areas of assessment for Sunlight, Daylight and Views. The goal is to explore the standard as a tool in the architectural design process, from early simple models to developed design. Using the EN 17037 in design workflows rather than post-design assessments could provide clarity, increase the adoption of these methods, and inform the design with actionable insights. Faster analysis through computational methods for EN 17037 could influence positively the design of buildings. Previous research has demonstrated the links of views and daylight to health and wellness in buildings (Aries et al., 2010; Commission Internationale de l ́Eclairage [CIE], 2009), but does not put forward ways to use and communicate results for designers e.g., workflows, colour-coded visuals of performance to support data-driven architectural design. Thus, the research explores new methods for EN 17037, that can result in faster and clear ways that can be utilized in academia and by practitioners.
Sunlight provision in EN 17037 has three performance levels that are 1.5, 3 and 4 hours of direct sun. Direct sunlight cannot be counted below minimum solar altitudes on 1 February and 21 March, and maximum solar azimuth on 1 February for given locations in EN 17037 tables D.1 and D.2. The evaluation is performed for a reference point of a window. It does not consider computational methods, that could be used with 3D models, on a spatially distributed grid of points. The workflow herein proposed uses ‘Sun Path’ and ‘Direct Sun Hours’ components in Ladybug Tools (Sadeghipour Roudsari & Pak, 2013) to perform an EN 17037 compliant sunlight assessment. The colour-coded results can be categorized according to any of the three performance levels or as one colour-coded map. The geometry was translated into a mesh grid for simulation between 1 – 2 metres as an appropriate level of accuracy. A timestep of 10 minutes for the sun vectors was used to allow for accurate sub-hourly results and balance computation time, to use the simulation feedback in an iterative process. Sun altitudes and solar azimuth values in annexe tables in EN 17037 are used to filter in only those sun vectors that contribute to direct sunlight for standard compliance. New methods of assessment of solar access and solar envelopes have been proposed recently (de Luca et al., 2021), and are implemented in the plugin the ‘Solar Envelope Tools’ from Tallinn University of Technology. However, such workflows pre-determine the building shape and apply to already built-up areas. The objective of the proposed method is to explore how the performance of design options on 3D models, with extracted results in terms of façade area in square metres (or as percentages), can inform design decisions without prior restriction e.g., building distances, massing, program, window location and size, the layout of units (exposure or disposition on two levels) to reach a minimum or higher levels of sunlight provision for the buildings to be designed, as well as considering the impact on the existing buildings.
Daylight simulations are performed with Ladybug Tools’ Honeybee plugin, which connects to Radiance for point-in-time daylight factor, and annual daylight simulations. Visual scripting in Grasshopper is used to produce the results according to daylight metrics of EN 17037 and selected climate-based metrics.
In EN 17037, Daylight is considered adequate if a target illuminance (Et) is reached across 50% of the reference plane and a minimum target illuminance (Et,min) achieved respectively across 95% of the plane, categorized in three levels of recommendation that are given in Table 1.
Method 1 of EN 17037 uses corresponding Daylight Factors determined by the internal illuminance and Ev,d,med of the local climate. Method 2 uses dynamic daylight provision of Illuminance levels for at least 2190 hours (i.e., half of the daylight hours of the year). Currently, and to our best knowledge, there is no software implementation available for calculating Method 2.
Table 1. Summary of EN 17037 reference values, and specific DF and Et values for Finland.
Area of assessment | Means of assessment | Level of recommendation | ||
Minimum | Medium | High | ||
Sunlight Provision | Daily Sunlight Exposure | ≥ 1.5 h | ≥ 3 h | ≥ 4 h |
Daylight Provision (Illuminance or corresponding DF), Finland values | Illuminance target | 300 lux | 500 lux | 750 lux |
Daylight Factor target | 2,2 % | 3,7 % | 5,6 % | |
Illuminance minimum target | 100 lux | 300 lux | 500 lux | |
Daylight Factor minimum target | 0,7 % | 2,2 % | 3,7 % | |
Quality of View out | Horizontal Sight Angle | ≥ 14 ° | ≥ 28 ° | ≥ 54 ° |
Outside distance of view | ≥ 6 m | ≥ 20 m | ≥ 50 m | |
No. Layers seen (Ground, Sky, Landscape) | 1 | 2 | 3 | |
Glare Protection | DGPe<5% | < 0.45 | < 0.40 | < 0.35 |
Climate based metrics such as spatial Daylight Autonomy (sDA) and Annual Sunlight Exposure (ASE) present in LEED are based on ‘occupied hours’ as described in IES-LM83 (2013). In addition, the Useful Daylight Illuminance (UDI), using the same occupied hours' schedule (8 am – 6 pm) will be presented in the results. Since daylight provision in EN 17037, is based on (1) local climate files, and (2) the same principle of concurring climate based metrics where illuminance levels are considered valid for at least half of the hours of the period considered, the results of each can be compared. Only the minimum level of recommendation, Et of 300 lux, and Et,min of 100 lux is considered, as it provides (1) the best correlation with daylit area studies, and (2) for comparison with CBDM metrics. Corresponding Daylight Factors to Illuminance values for Finland are provided in Table 2. Both methods 1 and 2 in EN 17037 were used to compare the results with existing Climate Based Daylight metrics.
Table 2. Extracted from EN 17037 Table A.3: Daylight Factor values for Finland to exceed illuminance level of 100, 300, 500 or 750 for a fraction of daylight hours Ftime, % = 50%.
Nation | Capital | Median External Diffuse Illuminance Ev,d,med | Geographical latitude φ [°] | DF ≥ 100 lux | DF ≥ 300 lux | DF ≥ 500 lux | DF ≥ 750 lux |
Finland | Helsinki | 13500 lux | 60,32 | 0,7 % | 2,2 % | 3,7 % | 5,6 % |
An open-space office building in Helsinki (Finland) was used for comparing selected daylight metrics. The case study features core zones in the centre and collaborative spaces with glazed partitions around the core for daylight. Work desks in the open space are distributed around the perimeter. The building has cantilevered slabs and façade frame elements every 1 metre, at the outer part of the glazing and along all orientations. The first level of the buildings was subject to daylight simulations with Ladybug Tools’ Honeybee plug-in in Grasshopper with a high-level setup, provided by Honeybee components. The space dimensions are 90.0 m in length, 25.0 m wide, and 3.4 m in height. Section B.3.1 of Calculation methods in Annex B of EN 17037, recommends reflectance values (Tvis) for main surfaces. Table 3 reports the values utilized in the Honeybee daylight model. Model properties are within the ranges recommended in EN 17037.
Table 3. Daylight surface properties.
Element | Light Reflectance / Tvis | |
Honeybee – Radiance model value | EN 17037 Annex B recommended range of values | |
Ceiling | 0,8 | 0,7 to 0,9 |
Interior Walls | 0,5 | 0,5 to 0,8 |
Floor | 0,2 | 0,2 to 0,4 |
Exterior Walls | 0,35 | 0,2 to 0,4 |
Exterior Ground | 0,2 | 0,2 |
Context | 0,2 | - |
Exterior glazing | 0,64 | - |
Numerous studies have been dedicated to the evaluation of the quality of views from windows and the correlation between daylight and visual comfort (C. Reinhart, 2018). Comprehensive frameworks for views and related metrics have been developed recently in research (Ko et al., 2021; Turan et al., 2020, 2021). Further research and limitations were identified in each study. The development of View metrics in EN 17037, green building standards and recent research need to be evaluated scientifically and integrated into architectural practice. The implementation in CAD and BIM tools or through Visual Programming remains underdeveloped. Currently, the Ladybug Tools plug-in (Version 1.4.0, 2022) for Grasshopper in Rhino offers a few components for simulating View types that are too generic for EN 17037 and the metrics of recent research. ‘View Out’ methods in EN 17037 refer to point-in-space assessments as presented in Annex C. The View method presented develops further on the framework of ‘View Out’. Three algorithms are implemented in Grasshopper for computing the components of the View Out in EN 17037 that are (1) Horizontal Sight Angle, (2) Outside Distance of View and (3) Number of Layers Seen.
Ko defined three variables of views that are View content, view access, and view clarity (Ko et al., 2021). View content is determined as the ‘layers seen’ in EN 17037 i.e., ground, sky, and landscape (built or natural). ‘View access’ is considered in the computation of each ‘layer seen’. View access is defined as ‘how much of the view can be seen through the window from the occupant’s position’ (Ko et al., 2021), and is captured in the implemented algorithm in the geometry-based computation of each ‘layer seen’. ‘View clarity’ from the window is not considered in EN 17037 and neither in the computational method presented in the paper. The simulation is performed for a spatially distributed grid in the interior floorplan at seated eye-level 1.2 m above the floor. The definition of Outside Distance of the view in EN 17037 is given as “distance from the inner surface of view opening to opposite major obstructions located in front of the opening”. Thus, the same level of performance would result for each point in space within the floorplan. The method proposed evaluates the view distance on basis of the ‘position in space’ and ‘potential view directions’. The algorithm uses vector ray-tracing and measures the distances for each grid point to the ground and nature, or to all layers within a distance limit e.g., 100 m. An average result of the distances (remaining vectors that were not obstructed by the interior geometry) for each grid point is used.
The computational methods are tested on real-world case studies in Helsinki. Simulations were performed during early and developed design iterations by the first author of the paper.
The results are presented for a new development project with existing surrounding buildings in Figure 1. The colour-coded maps are for a default sunlight analysis in Ladybug, a 1.5 hours performance level, and an EN 17037 complete sunlight assessment. February 1st was chosen as the analysis period as it is more restricting than the 21st of March, and all performance levels in EN 1037 resulted in the facades of the case study. The simple model can be contoured with lines to guide the designer in relating the performance of the façade to the building level.
The areas corresponding to each level of performance are extracted from the simulation, in the unit of square metres, and as percentages, and represented in charts in Figure 1. Additionally, charts can be generated within Rhino for tracking the progress of design iterations with Grasshopper plugins such as “Conduit” and “Human UI”.
This part of the study presents a comprehensive review of climate based daylight metrics and EN 17037 daylight methods for an open space office building with openings on all facades and orientations in Helsinki, Finland. Daylight Autonomy (DA) in conjunction with Annual Sunlight Exposure (ASE) and UDI is shown in Figure 2. The contour lines representing 50% of the time for DA, the threshold of 300 lux, and the UDI range of 100-3000 lux range are indicated. Spatial DA and UDI results are given. The colour-map is categorized in 10% steps for ease of comparing spatially the results of metrics.
Annual Sunlight Exposure (ASE) of at least 250 hours for more than 1000 lux of direct sun is presented and categorized every 250 hours up to 1000 hours, to show a higher level of granularity and visualize the differences between orientation exposures and the impact of the position in proximity to glazing.
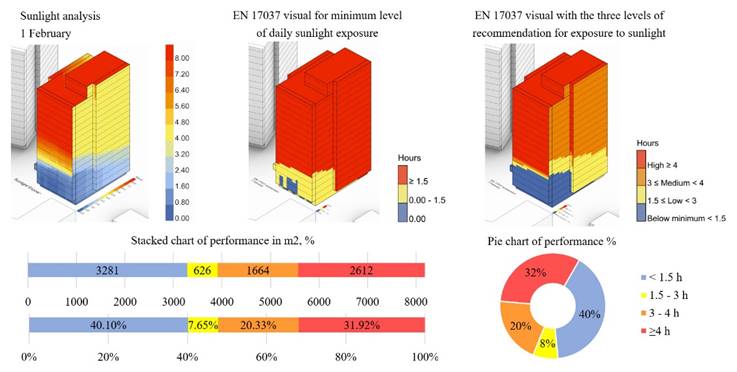
Figure 1. Left to right. Southeast views of colour-coded sunlight analysis, categorized based on EN 17037minimum level, categorized based on the three performance levels in EN1703. Charts with results.
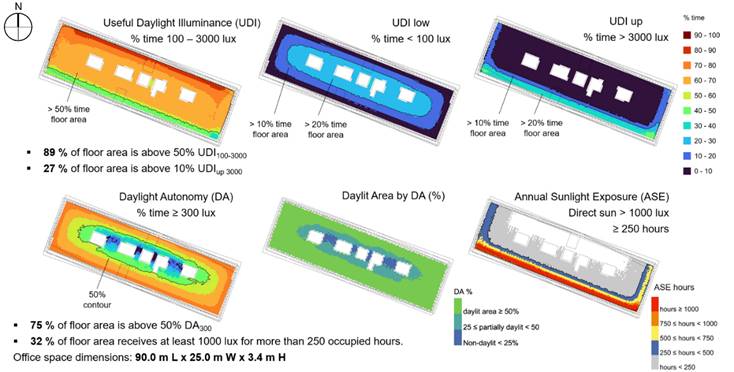
Figure 2. Climate Based Daylight metrics for an open space office building in Helsinki.
Daylight Illuminances below 100 lux are considered insufficient (UDIlow) and when exceeding the useful range (UDIup) are likely to produce visual or thermal discomfort, or both (Nabil & Mardaljevic, 2006). Contour lines of 10% and 20% of the time for UDIlow and UDIup are shown in Figure 2 for comparison of metrics. There is a 5% point difference between UDIup of 27% and ASE of 32% across the space. While there are some differences between UDIup and ASE, there is a similarity in the spatial distribution of results between ASE>1000lux,1000h to UDI>3000lux,>20%, and ASE>1000lux,250h to UDI>3000lux,>10%.
Daylight Factor and Illuminance levels based on EN 17037 methods are simulated and presented. The design proposal fails to meet the requirements of EN 17037 based on the Daylight Factor. An “Option 2” of the Daylight Factor is calculated when a larger core area is not considered in the results, as indicated by a dashed rectangle in the right-side colour-map in Figure 3.
The following differences are found:
· Spatial Daylight Autonomy (DA300lux,50%)of 75% versus a target Daylight Factor that is met for 38% of the reference plane. There is a 37% point difference for a target illuminance of 300 lux between sDA and DF (method 1, EN 17037).
· 63% of floor area is above Illuminance levels (method 2) of 300 lux. Compared to the Daylight Factor, there is a 25% point difference in spatial results.
· sDA300lux,50% (based on occupied hours) results are higher by 12% points compared to the fraction of plane meeting Illuminance levels for half of the daylight hours as in EN 17037 method 2.
Additionally, a comparison of results between EN 17037, LEED, and BREEAM daylight metrics is given in Table 4. The WELL standard is not presented, as it is based on the IES LM-83-12 standard as in LEED, or using EN 17037 methods, with average sDA targets of 55% and 75% for regularly occupied spaces.
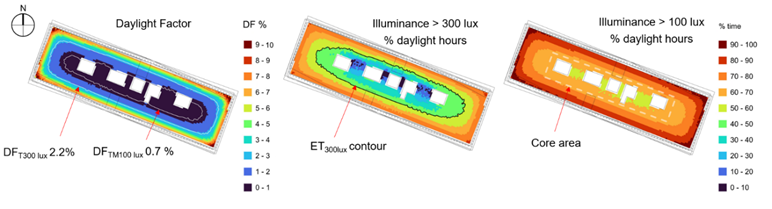
Figure 3. Left to right. Daylight Factor (target and minimum target), Illuminance levels of 300 lux, Fplane,50% and 100 lux Fplane,95% based on actual daylight hours as in method 2 for Daylight Provision in EN 17037.
Table 4. Comparison of simulation results of EN 17037 daylight methods and selected standards.
Daylight metric | Target value | DF, Fplane (option 1) | DF, Fplane (option 2) | Illuminance levels, Fplane (option 1) | |
EN 17037 | Et 300 lux, Fplane50% | ≥ 2.2% | 38% | 50% | 63% |
Et min100 lux, Fplane95% | ≥ 0.7% | 81% | 97% | 100% | |
LEED v4.1 sDA300/50% | 40%, 55%, 75% | - | - | 75% | |
UDI100-3000/50% | - | - | - | 89% | |
BREEAM INT NC v6 | 2.2% | 2.4% | 2.9% | - | |
The method is tested on a master plan and shown for a unit of residential development with context buildings in Helsinki in Figure 4. The potential of incorporating view analysis early in the design process is presented. The location of the unit in the design and its context are shown in wireframe display mode in Rhino in Figure 4. ‘View content’ is composed of the “layers seen” as defined in EN 17037. The dimensionality from 1 to 3 levels can be extended by adding geometrical objects that account for the “quality of environmental information” in the computation of the View metric. Based on real-world conditions, simple geometrical elements can be modelled to increase or reduce the score of the view.
The computation on a spatially distributed grid for the Outside Distance shows differences in the reference plane regarding the level of performance based on the position in space and view direction in the interior, in an urban setting with varying morphological features and building heights. The façade-based distance evaluated with a plane projection suggests there is only a medium level of performance per every floor as shown in Figure 4. It would influence to a greater extent the cumulative Quality Views assessment. When the performance of the “outside distance” metric is lower than the other two metrics, it would override the colouring and performance level of the total view evaluation. The viewpoint-based ‘outside distance’ is combined with the ‘Layers Seen’ and ‘Horizontal Sight Angle’ in one visualisation for communication purposes. However, the granularity of information from eacg metric is partially lost in the combined “Quality Views” evaluation in the case study.
The results can be further analysed by extracting the area (m²) for each level of performance and deriving a “spatial metric” for the View. In addition, as in the Sunlight method, a stacked or pie chart with area in the unit of m² or % for each performance level can be used to predict the performance of a building when design variables change e.g., façade patterns, building layout, window size & locations, internal obstructions.
The developed method achieves the following:
· Translating EN 17037 View methods into near real-time spatial assessment in a design modelling environment.
· View access based on space geometry is embedded in the computation for each layer seen.
· Understand the implications of decisions early, how window size and location, shadings, and facade elements can influence access to views and its performance.
· The difference between Point-of-view Outside Distance versus Façade-based Outside distance is presented.
· Additional levels of performance are needed and can be added to the score for the quality of the environmental information (e.g., art, landmark, natural, water) with computational design tools.
· Layers Seen metric limitation is suggested e.g., Low-rise can have higher levels of three layers seen across the reference plane. Depending on urban morphology, lower floors could see the Ground layer and not Sky, while, higher floors could see Sky but not the Ground layer.
· Spatial metrics (% space) can be extracted from the results.
This paper explores the potential of using the European Daylight Standard as a design tool rather than just an assessment method through its introduction to computational design workflows. The graphical methods and reference values of the standard are transformed into algorithms to automate parts of the process for evaluating projects, towards near real-time spatial assessments, that are communicated with colour-coded visuals in 3D models in a popular 3D modelling environment for architects such as Rhino. Novel computational methods with Sunlight, Daylight and Quality Views can help architects to achieve higher goals of Regenerative Design. Solar access requirements are present in many local regulations at European and International levels. CAD and BIM tools can visualize a 3D Sun Path, and shade the model, but lack the development of analysis features to evaluate the design or its surrounding context. Visual scripting in Grasshopper and Ladybug Tools plug-ins are used to develop design-based workflows for evaluating the performance to improve designs. An iterative design process, single or multi-objective optimization can be used.
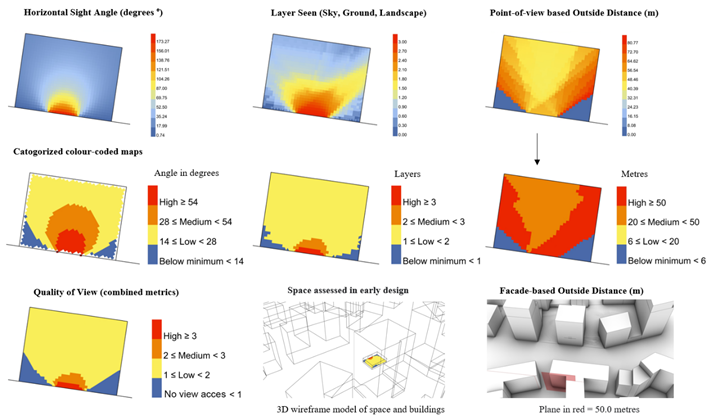
Figure 4. Spatially computed metrics for View Out in colour maps, categorized colour maps, and cumulative visualization of Quality Views developed from EN 17037.
The results of the Sunlight analysis can be used for improving the design according to the following:
· Improve masterplan e.g., distances between buildings, or adjust the shape of the designed building.
· Adjust program e.g., of building levels and internal layout of units/offices, core zones, and other functions.
· Allow for sunny/shaded open spaces and courtyards based on climate and season.
· Provide units with double exposure, or on two levels to reach the minimum or higher levels of sunlight recommendation on basis of the standard.
· Add rooms in the building layout that receive sunlight to units that could benefit from it.
· Add new/larger windows to units where low levels of sunlight result from the simulation.
Further research can explore the influence of climate, day of analysis, and simulation parameters in the evaluations of Sunlight performance.
Different Climate Based Daylight metrics inform the design in different ways. DA suggest the design is performing well along the perimeter for all exposures. UDI would suggest that the North façade has the highest daylight potential and that the South façade performs below the threshold 50% of the time, between 40-50%. UDI<100lux,>20% can be an indicator of the need for integrative artificial lighting in the design.
ASE appears to be more detailed in representing differences due to orientation. However, UDI is the result of a single and easier simulation workflow. Since UDIup results are comparable to ASE, further research could indicate its potential as a superseding metric of DA and ASE for standards and regulations.
The Daylight Factor method in EN 17037 would suggest the design does not meet the minimum level of performance in the standard. However, annual daylight metrics using occupied hours schedules or daylight hours indicate that the design is compliant. Relying solely on the Daylight Factor would suggest providing higher a Window-to-Wall ratio and light transmittance of glazing. Even in a Nordic climate with fewer sunshine hours, the Daylight Factor has a considerable difference in results from climate-based daylight metrics. Future studies can explore the influence of climate, shadings and their dynamic modelling in simulations.
New frameworks for Views take a holistic approach to a complex subject. However, fast and easy to use workflows are needed to increase adoption in by practitioners, going beyond traditional daylight performance and visual comfort studies. An overview of the three components of the “Quality Views” and a combined visualisation is recommended, to avoid bias from just one combined representation. A Spatial metric (% space) can inform the design. Having a myriad of real-world possibilities for “Views”, further studies are needed to explore how this approach could be useful and to provide recommendation levels based on urban categories such as dense urban environments, low density, low-rise, high-rise, and suburban areas.
A critical review is needed to turn the results into actionable insights and avoid bias of metrics, and the identified limitations of metrics in this and previous studies. For example, is the condition of low-rises better in reality when it comes to views? The View quality depends on a wide range of real-world factors such as location, landmark or natural values, human preferences e.g., noise, privacy, thermal comfort, and something to gaze at.
Flexibility, adaptability and reuse of buildings is a topic of growing interest to transition towards a low carbon and circular built environment. During the pandemic, the nature of work changed, where more work could be done in-home settings. The following question arises. Is “daylight hours” better than the “occupied hours” method for annual daylight metrics if we are to think of new hybrid and flexible working hours, and adaptable buildings for the future?
New computational methods developed in line with the EN 17037 standard are proposed at both the urban and architectural scales to support the design process for sunlight provision, daylighting and quality views. Significant differences between current Climate Based Daylight metrics and both EN 17037 methods are presented, suggesting the need for a transition towards annual daylight simulations. The Quality Views on basis of the View Out method in EN 17037 is developed further with computational methods and results are presented for an early design case study in an urban context. The developed workflows can be currently performed in Rhino and Grasshopper. Visualizing colour-coded results in the 3D models is recommended to support an iterative and collaborative process. Simulations need not be performed in the end for building permit applications but for every design stage to make informed decisions. Parametric, computational and data-driven approaches have the potential to aid architects to explore the design with the performance and well-being evolving requirements in today's practice.
The research was supported by KTH Royal Institute of Technology in Stockholm, Sweden.
Abbreviation | Term |
ADF | Average Daylight Factor |
ASE | Annual Sunlight Exposure |
BIM | Building Information Modelling |
BRE | Building Research Establishment |
CAD | Computer-aided design |
CEN | European Committee for Standardization (CEN, French: Comité Européen de Normalisation) |
CIE | Commission Internationale de l ́Eclairage |
CBDM | Climate Based Daylight Modelling |
DA | Daylight Autonomy |
DF | Daylight Factor |
DGP | Daylight Glare Probability |
Et | Illuminance, target |
Et min. | Illuminance, minimum target |
EN 17037 | Daylight in buildings (European standard) |
Fplane | Fraction of the reference plane |
Ftime | Fraction of time (hours) considered based in the EN 17037 daylight method |
IES | Illuminating Engineering Society |
IWBI | International WELL Building Institute |
LEED | Leadership in Energy and Environmental Design |
LM | Lighting Method |
sDA | spatial Daylight Autonomy |
Tvis | Visible Light Transmittance |
UDI | Useful Daylight Illuminance |
UDI low | % time UDI < 100 lux |
UDI up | % time UDI > 3000 lux |
USGBC | U.S. Green Building Council |
WELL | WELL Building Standard |
Aries, M. B. C., Veitch, J. A., & Newsham, G. R. (2010). Windows, view, and office characteristics predict physical and psychological discomfort. Journal of Environmental Psychology, 30(4), 533–541. https://doi.org/10.1016/J.JENVP.2009.12.004.
Bournas, I. (2020). Daylight compliance of residential spaces: Comparison of different performance criteria and association with room geometry and urban density. Building and Environment, 185, 107276. https://doi.org/10.1016/J.BUILDENV.2020.107276.
Building Research Establishment. (2021). BREEAM International New Construction Version 6.0. https://www.breeam.com/discover/technical-standards/newconstruction/.
Cole, R. J. (2012). Regenerative design and development: current theory and practice. Building Research & Information, 40(1), 1–6. https://doi.org/10.1080/09613218.2012.617516.
Commission Internationale de l ́Eclairage (CIE). (2009). Ocular lighting effectson human physiology and behaviour. CIE, 2004/2009, ISBNCIE 158:2009. https://cie.co.at/publications/ocular-lighting-effects-human-physiology-and-behaviour-0.
de Luca, F., Dogan, T., & Sepúlveda, A. (2021). Reverse solar envelope method. A new building form-finding method that can take regulatory frameworks into account. Automation in Construction, 123, 103518. https://doi.org/10.1016/j.autcon.2020.103518.
European Committee for Standardization. (2022). Daylight in buildings. (EN 17037). Http://Store.Uni.Com/Catalogo/Uni-En-17037-2022.
IESNA-Daylight Metrics Committee. (2013). Lighting measurement #83: Spatial Daylight Autonomy (sDA) and Annual Sunlight Exposure (ASE). Illuminating Engineering Society. https://store.ies.org/product/ies-spatial-daylight-autonomy-sda-and-annual-sunlight-exposure-ase/.
IWBI. (2022). WELL Building Standard v2. https://v2.wellcertified.com/en.
Klepeis, N. E., Nelson, W. C., Ott, W. R., Robinson, J. P., Tsang, A. M., Switzer, P., Behar, J. v, Hern, S. C., & Engelmann, W. H. (2001). The National Human Activity Pattern Survey (NHAPS): a resource for assessing exposure to environmental pollutants. Journal of Exposure Science & Environmental Epidemiology, 11(3), 231–252. https://doi.org/10.1038/sj.jea.7500165.
Ko, W. H., Kent, M. G., Schiavon, S., Levitt, B., & Betti, G. (2021). A Window View Quality Assessment Framework. LEUKOS, 0(0), 1–26. https://doi.org/10.1080/15502724.2021.1965889.
Ladybug Tools (1.4.0). (2022). https://www.ladybug.tools.
Love, J. A. (1992). The evolution of performance indicators for the evaluation of daylighting systems. Conference Record of the 1992 IEEE Industry Applications Society Annual Meeting, 1992-January, 1830–1836. https://doi.org/10.1109/IAS.1992.244539.
Mang, P., & Reed, B. (2013). Regenerative Development regenerative development and Design. In Sustainable Built Environments (pp. 478–501). Springer New York. https://doi.org/10.1007/978-1-4614-5828-9_303.
Mardaljevic, J., & Christoffersen, J. (2017). ‘Climate connectivity’ in the daylight factor basis of building standards. Building and Environment, 113, 200–209. https://doi.org/10.1016/j.buildenv.2016.08.009.
Nabil, A., & Mardaljevic, J. (2006). Useful daylight illuminances: A replacement for daylight factors. Energy and Buildings, 38(7), 905–913. https://doi.org/10.1016/j.enbuild.2006.03.013.
Naboni, E., & Havinga, L. (2019). Regenerative Design In Digital Practice. A Handbook for the Built Environment.https://www.eurestore.eu/publications-and-articles/.
Reinhart, C. (2018). Daylighting Handbook II.
Reinhart, C. F., & Weissman, D. A. (2012). The daylit area – Correlating architectural student assessments with current and emerging daylight availability metrics. Building and Environment, 50, 155–164. https://doi.org/10.1016/J.BUILDENV.2011.10.024.
Robert McNeel & Associates. (2020). Rhinoceros 3D (Version 7.15). https://www.rhino3d.com.
Sadeghipour Roudsari, M., & Pak, M. (2013). Ladybug: A parametric environmental plugin for grasshopper to help designers create an environmentally-conscious design. Proceedings of BS 2013: 13th Conference of the International Building Performance Simulation Association, 3128–3135. http://www.ibpsa.org/proceedings/BS2013/p_2499.pdf.
Šprah, N., & Košir, M. (2020). Daylight provision requirements according to EN 17037 as a restriction for sustainable urban planning of residential developments. Sustainability (Switzerland), 12(1). https://doi.org/10.3390/su12010315.
Turan, I., Chegut, A., Fink, D., & Reinhart, C. (2021). Development of view potential metrics and the financial impact of views on office rents. Landscape and Urban Planning, 215. https://doi.org/10.1016/j.landurbplan.2021.104193.
Turan, I., Reinhart, C., & Kocher, M. (2020). A New Framework for Evaluating Views throughout Open Plan Work Spaces. Proceedings of Building Simulation 2019: 16th Conference of IBPSA, 16, 1098–1105. https://doi.org/10.26868/25222708.2019.210755.
U.S. Green Building Council. (2021). LEED v4.1 for building design and construction. https://www.usgbc.org/leed/v41.
Follow us on social media accounts to stay up to date with REHVA actualities
0