

Stay Informed
Follow us on social media accounts to stay up to date with REHVA actualities
|
|
Alex Siu-fung Fung | Volkan Doda |
University College London | Atelier Ten London Limited |
Europeans spend approximately 90% of their time indoors for work, study and living (EVIA, 2022), while nearly 40% of global energy demand is attributed to building sector (UNEP, 2022). The quality of living, health, productivity, and satisfaction of building occupants are generally correlated to the Indoor Environmental Quality (IEQ), which encapsulates four major environmental conditions, namely, thermal comfort, air quality, luminous quality, and acoustic quality (CIBSE, 2015). The average loss of human life expectancy due to particulate pollution alone is estimated to be 2.2 years (AQLI, 2022). Office users can be benefited from interventions in their working environment, in return for their enhanced health, comfort and productivity (Felgueiras et al., 2022). In the post-pandemic era, provision of good IEQ in indoor premises whilst minimizing energy consumption is vital for a return to normal life without sacrificing wellbeing and climate change aversion measures. This is where CIBSE’s new TM68 fills a competence gap by equipping practitioners with guidance on the selection and implementation of tools and methods that can assist with improving thermal comfort, air quality, luminous quality, acoustic quality whilst supporting improvements in energy performance. The next section presents an overview for each of these aspects and they are summarized in Figure 1to 4 for ease of reference.
Thermal comfort is defined as the “condition of mind that expresses satisfaction with the thermal environment and is assessed by subjective evaluation”(ASHRAE, 2021). Thermal comfort is influenced by physical parameters listed in Figure 1, for example, air temperature, radiant temperature, air velocity and relative humidity, which can be measured and monitored by various sensors. Personal parameters, including metabolic rate and clothing insulation, are not directly measured and they can be referenced from guidelines and standards instead. The effect of the above factors on thermal comfort can be quantitatively evaluated by different performance metrics for naturally and mechanically ventilated buildings. Common instruments and sensors used for continuous monitoring are temperature probes, humidity probes and occupancy sensors. In addition to selecting appropriate sensors, several sampling issues should be considered. Frequency and granularity of data collection should be informed by the investigated variables and project specific requirements. Instruments should preferably be small to capture distinctive indoor climatic parameters and they should be mounted one meter away from the walls. Furthermore, capturing parameters for several consecutive summers can enable the investigation of longitudinal trends and the effect of year-to-year weather variations while a monitoring protocol should also be developed to define the function and location of sensors in various spaces.
Performance Metrics / Categories | Unit | Measurement Range | Accuracy Characterization | Sampling Consideration | Commonly Used Instrument | Calibration | |
(General) | (Parameter Specified) | ||||||
Mechanical Conditioned: PMV and PPD (ASHRAE Standard 55) or OR Naturally Conditioned: Adaptive Model (CIBSE TM52/59, ASHRAE Standard 55) | Air Temperature, Ta [°C] | 10 - 40°C | ±0.2°C (Air) ±0.5°C (Draught) | • Define “Monitoring protocol” – capture representatives’ environment • Frequency: depend on the variable being investigated • Able to capture periods of typical weather, ideally consecutive years • Early monitoring may not be representative • Parallel OA measurements | • Mean of 3 levels - Ankle: 0.1 m - Waist: 0.6 m / 1.1 m - Head: 1.1 m / 1.7 m (Seated/Standing) • Average from 3 to 15 mins • Start when t > 1.5 Probe’s response time | Thermometer | Temperature-controlled environments (hot baths, furnaces, ‘dry-block’ calibrators, …) |
Mean Radiant Temperature, Tr [°C] | 10 - 40°C | ±1°C | 20 - 30 mins response time | Black Globe Thermometer | N/A | ||
Air Velocity, Va [m/s] | 0.05 – 2 m/s | ±0.05°C (Air) ±0.05(1+Va)°C (Draught) | N/A | Hot-sphere Anemometer (or Draught Probe) | Wind tunnels or wheels every 6 months | ||
Relative Humidity, RH [%] | 25 - 95% | ±5% | Measured at centre height | Capacitive Humidity Sensor | Fixed-point humidity system | ||
Occupancy | Up to 12 m (>130°) | Up to 98% | N/A | Passive Infrared | Not required | ||
Operative Temperature, To [°C] | N/A | • Measured at 0.6 m (seated) or 1.1 m (standing) • H-value weighted average of Ta and Tr | N/A | ||||
Metabolic Rate, M [met] | Refer to Guidance and Tables in CIBSE Guide A, BS EN ISO 8996-2004, ASHRAE Standard 55-2020 | ||||||
Clothing Insulation, C [clo] | Refer to Guidance and Tables in CIBSE Guide A, BS EN ISO 9920-2007, ASHRAE Standard 55-2020 | ||||||
Figure 1. Summary of Thermal Comfort in CIBSE TM68 Indoor Environmental Quality Monitoring (CIBSE, 2022).
The inhalation of airborne pollutants in our environment can result in adverse health impacts, such as respiratory and cardiovascular diseases. Most of these pollutants are relevant to the concept of indoor air quality (IAQ). An acceptable IAQ can refer to “air in which there are no known contaminants at harmful concentrations, as determined by cognizant authorities, and with which a substantial majority (80% or more) of the people exposed do not express dissatisfaction”(ASHRAE, 2022). Common pollutants include carbon dioxide (CO2), carbon monoxide (CO), nitrogen oxide (NOX) and volatile organic compounds (VOC) as tabulated in Figure 2. Measurement of their concentration for IAQ assessments and monitoring in accordance with health-based guidelines requires different well-calibrated sensors and instruments. Particularly, CO2 and total VOC (tVOC) are proxies used in the evaluation of ventilation and air quality. Short-term (less than one hour) and long-term (few days to few weeks) aggregated sampling can be used to assess the acute and chronic health risks respectively. In terms of sampling considerations, the recommendations are similar to those considered for thermal comfort. However, measurements in winter should be recorded with care as higher ambient pollutant concentration and lower ventilation rate during the heating season often result in the “worst case’ conditions.
Performance Metrics / Categories | Unit | Measurement Range | Accuracy Characterization | Sampling Consideration | Commonly Used Instrument | Calibration |
Pollutant / Chemical Concentration | C [µg/m³], [ppm] or [ppb] | Refer to WHO Methods for Sampling and Analysis of Chemical Pollutants in Indoor Air 2020 and ISO 16000 Series | • No single classification system • Uncertainty
estimates (Discontinuous sample): • Compliance Checking - CO: ±15% - PMx: ±25% - O3 and NOx: ±15% | • Measure at centre of representative rooms (5-10% of total space) - >1 m to any wall - 1-1.5 m above floor - OA measurement at the same story level - Avoid position near FA intake • Frequency - Short-term Aggregated: <60 mins - Long-term Aggregated: Few days to a number of weeks - Continuous/Real-time: Few hours to many months - At least 1 period in both heating and non-heating season | Miscellaneous | • Caution with software calibration • Co-locate sensor with accurate reference sensor • Review “raw” data for signs of drift or change in accuracy |
Proxies of Air Quality | Carbon Dioxide (CO2) | |||||
Total Volatile Organic Compound (TVOCs) | ||||||
Condensation / Visible Mold | ||||||
Health-based Guideline | (Maximum concentration threshold averaged over a specified time period) | Refer to Table 9.1 and Figure 9.5 of CIBSE TM40 Health and Wellbeing in Building Services |
Figure 2. Summary of Air Quality in CIBSE TM68 Indoor Environmental Quality Monitoring (CIBSE, 2022).
The quality of the indoor luminous environment is generally monitored by the illuminance and luminance of the illuminated space. As there is no single definition of good luminous quality, it should be assessed by considering the light sources, use of building and other factors. The assessment of indoor luminous quality frequently emphasizes identification of sources of visual discomfort (or glare) and sufficiency of available light, in other words, whether the spot or average horizontal illuminance is sufficient to perform a specific task. Figure 3 suggest common instruments shown as luxmeters and luminance sensors, which should be calibrated with reference to the angle of incidence and the photopic V(λ) curve for human eye sensitivity. For continuous monitoring, the lower price of luxmeters using illuminance sensors makes them more attractive than the luminance-based systems. The sensors should be located to mimic the field of view and eye level height of the space occupants. A typical measurement frequency in the range of 10 to 15 minutes is recommended, but this should also be informed by the time and weather conditions. Parallel outdoor measurements should be conducted in close proximity to the investigated indoor spaces. These outdoor sensors should be weather-resilient and able to capture high illuminance readings due to potential exposure to direct sunlight.
Performance Metrics / Categories | Unit | Measurement Range | Accuracy Characterization | Sampling Consideration | Commonly Used Instrument | Calibration |
Lighting Sufficiency: (1) Average Horizontal Illuminance (2) Daylight Factor or (3) Climate-based Daylight Modelling (CBDM) Visual Discomfort: Unified Glare Rating (UGR) | Luminous Intensity, I [cd] | Refer to CIBSE SLL Lighting Handbook 2018 | N/A | • Minims the positions and FOV of a building occupant • Group position receiving similar light level • Time step = 10 – 15 mins or shorter • Weather resistant and able to record high outdoor illuminance values | N/A | |
Luminous Flux, F [lm] | ||||||
Illuminance, E [lx] | Calibrate against the photopic V(λ) curve – Human eye sensitivity | Luxmeter | Standard lamp on the optical bench | |||
Luminance, L [cd/m²] | Luminance Meters or High Dynamic Range (HDR) Imaging | Laboratory reflectance tile | ||||
Correlated Colour Temperature, CCT [°K] | N/A | N/A | ||||
Colour Rendering Index, CRI [-] | ||||||
Figure 3. Summary of Luminous Quality in CIBSE TM68 Indoor Environmental Quality Monitoring (CIBSE, 2022).
Acoustics quality of indoor spaces is assessed by room acoustics, sound insulation and sound level, in which the latter one dynamically reflects the indoor acoustic environment. It can be evaluated on the basis of acoustic criteria, users and purposes of the concerned spaces. Continuous sound level monitoring generally adopts the A-weighted equivalent continuous sound level over a defined period of time. Collection of 15-minute A-weighted equivalent sound level is recommended to capture temporal characteristic, based on which the 10th and 90th percentiles reveal the background noise levels. However, 1-to-2-minutes sampling is also advised for spaces with shorter functional time units, for example, a one-hour university lecture. The captured data can be aggregated over a day, week, or month for longitudinal analyses. Sound level meters (SLM) and low-cost acoustic sensor networks are commonly used to measure the sound level in the audible range of 20 to 20,000 Hz. The tolerance level of class 2 SLM can be referred to Figure 4. Meters and sensors should be located to capture the noise exposure of the representative users in the investigated space. Symmetric positioning or mounting of sensors less than 1m away from sound-reflecting surfaces should be avoided.
Performance Metrics / Categories | Unit | Measurement Range | Accuracy Characterization | Sampling Consideration | Commonly Used Instrument | Calibration |
Statics: Dynamic: | A-weighted equivalent continuous sound level over period T, LAeq,T [dBA] | 20 – 20,000 Hz audible range | Tolerance level (dB) for Class 2 SLM - 16 Hz: -∞, +5.5 - 20 Hz: ±3.5 - 1 kHz: ±1.4 - 10 kHz: -∞, +5.5 - 16 kHz: -∞, +6.0 | • Provide noise exposure of the average user(s) • Distance between sensor and the nearest reflecting surfacing > 1 m • Avoid symmetric positioning • Frequency - Short Interval: LAeq,2min , LAeq,5min - Long/Temporal Interval: LAeq,15min | Sound Level Meters (SLM) or Acoustic Sensor Network | Speaker-white noise generator (Fernandez-Prieto et al., 2020) |
Figure 4. Summary of Acoustic Quality in CIBSE TM68 Indoor Environmental Quality Monitoring (CIBSE, 2022).
Design, operation, and management of IEQ monitoring systems involves further non-technical considerations over the lifecycle of the system. Figure 5 illustrates the overall decision-making process for selecting a continuous measurement system, which is similar to conventional engineering project workflow. Stakeholders of the project should establish realistic goals and expectations through communication with beneficiaries and delineating responsibilities among them. For example, combinations of required IEQ parameters, measurement locations and resolutions could be consolidated into a “wish-list”, which facilitates the onward economic appraisal and vendor involvement. Ethical and privacy concerns should be addressed by complying with the relevant standards on data protection or equivalent regulation of the corresponding jurisdiction. A robust data management plan should cover essential elements including consent, transfer, storage, limiting usage and deletion of data. Risk assessment developed in consultation with cyber security specialists is also recommended to undergo scheduled test and review. For successful implementation, data-informed outcomes related to human wellbeing should place equal importance to both technical and non-technical considerations listed above.
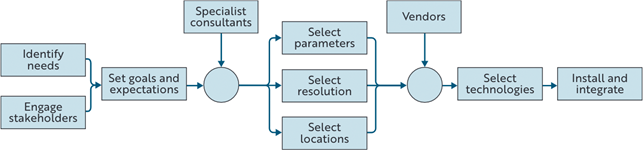
Figure 5. The decision-making process for selecting a continuous measurement system (CIBSE, 2022).
This article summarizes technical and non-technical considerations on continuous IEQ monitoring highlighted in CIBSE TM68. Key units and performance metrics, instruments and sensors, sampling considerations are briefly discussed for the four principal IEQ aspects. To retain holistic generality, building professionals are recommended to read the original TM68 in conjunction with the other relevant technical standards listed therein, as also summarized in Figure 1a and 1b. Future works could be focused on the application in smart building design and engineering, such as assessing health implication for indoor environment in conjunction with building energy optimization through development of timeless digital twin platform. Productivity studies could be conducted through implementing these recommendations.
AQLI. (2022). Reports Archive—AQLI. Reports Archive - AQLI. https://aqli.epic.uchicago.edu/reports/.
ASHRAE. (2021). 2021 ASHRAE® Handbook. Fundamentals (SI edition). American Society of Heating, Refrigerating and Air-Conditioning Engineers.
ASHRAE. (2022). ANSI/ASHRAE Standard 62.1-2022 Ventilation and Acceptable Indoor Air Quality. American Society of Heating, Refrigerating and Air-Conditioning Engineers.
CIBSE. (2015). Environmental design: CIBSE guide A (Eighth edition). Chartered Institution of Building Services Engineers.
CIBSE. (2022). Monitoring indoor environmental quality—CIBSE TM68:2022. Chartered Institution of Building Services Engineers.
EVIA. (2022). Indoor Air Quality l EVIA. Indoor Air Quality l EVIA. https://www.evia.eu/indoor-air-quality/.
Felgueiras, F., Cunha, L., Mourão, Z., Moreira, A., & Gabriel, M. F. (2022). A systematic review of environmental intervention studies in offices with beneficial effects on workers’ health, well-being and productivity. Atmospheric Pollution Research, 13(9), 101513. https://doi.org/10.1016/j.apr.2022.101513.
UNEP. (2022). Tracking progress | Globalabc. Tracking Progress | Globalabc. https://globalabc.org/our-work/tracking-progress-global-status-report.
Follow us on social media accounts to stay up to date with REHVA actualities
0