


Stay Informed
Follow us on social media accounts to stay up to date with REHVA actualities
|
|
|
|
|
Grace Zhou | Chang Shu | Justin Berquist | Janet Gaskin | Greg Nilsson |
Research and Development Director, National Research Council Canada (NRC) liang.zhou@nrc-cnrc.gc.ca | Research Officer, NRC chang.shu2@nrc-cnrc.gc.ca | Research Officer, NRC justin.berquist@nrc-cnrc.gc.ca | Research Officer, NRC janet.gaskin@nrc-cnrc.gc.ca | Research Council Officer, NRC gregory.nilsson@nrc-cnrc.gc.ca |
In 2023, a Canadian provincial government initiated a collaboration with the Ventilation and Indoor Air Quality (VIAQ) team of the National Research Council of Canada (NRC) to conduct a controlled intervention study to demonstrate the effectiveness of portable air cleaners (PACs) for improving occupants’ health and reducing indoor air contaminants in 2 schools, including infectious aerosols that cause respiratory illnesses and wildfire smoke that can have adverse respiratory and cardiac effects. To achieve this goal, the study examined the presence of particulate matter of 1- and 2.5- micron diameters (PM₁ and PM2.5), carbon dioxide (CO₂), selected viruses, and sick days reported by staff and students. This paper describes the study methods and the findings from the PM and CO₂ data collected between March and June 2023. The VIAQ team will include results from virus sampling from indoor air and surfaces, ventilation rates, and the sick days reported by students in future publications.
Two schools in the same city with similar characteristics including the year built, heating, ventilation, and air conditioning (HVAC) system, number of rooms (25-30), number of teachers, and number and age of students (kindergarten to Grade 8), were selected for this study. Phase 1 of the study was from March to June 2023. During this period, the control school relied solely on the existing HVAC system. The intervention school relied solely on the existing HVAC system in April, after which time, portable air cleaners (PACs) were used in each classroom, the teachers’ lounge, and the library.
Exhaled respiratory aerosols carrying pathogens are typically smaller than 5 μm, and a large proportion of them are smaller than 1 μm for most respiratory activities such as breathing, talking, and coughing (Fennelly, 2020; Wang et al., 2022). It is widely acknowledged that wildfires generally produce fine (<2.5 μm) and ultrafine particles (<1 μm), which pose the main health risks (Black et al., 2017; ECCC, 2023). In response to the COVID-19 pandemic, there have been many recommendations to monitor indoor CO₂ levels as an indicator of the risk of airborne transmission of pathogens and the adequacy of ventilation rates (CDC, 2021; EMG/SPI-B, 2021; REHVA, 2021). Therefore, monitors were installed in classrooms, hallways, and other spaces in both schools to continuously monitor the concentration of particulate matter (PM₁ and PM2.5), CO₂, temperature, relative humidity, and sound level in both schools. In each of the classrooms, one sensor was placed near the door (measurement location A), and another one was placed near an exterior wall/window (if present) or a wall on the opposite side (measurement location B). An outdoor sensor was mounted on the rooftop of each school to monitor these same parameters outdoors.
The provincial government selected the PACs with high efficiency particulate air filters to be used in the study based on the durability and control features of the device. Prior to the study, the NRC’s VIAQ team conducted lab testing to verify the airflow rate, air distribution, particle removal efficiency, and noise generated by the PACs to guide the deployment of these units in the schools. The airflow rates delivered by the PACs were adjusted based on the research team’s assessment of acoustic comfort in the classrooms and to increase the normalized clean airflow rate by 2 - 2.5 ACHs. The normalized clean airflow rate was calculated based on the measured airflow rate recirculated through the PAC units and the dimensions of the classrooms. The background noise level in the majority of classrooms was above 35 dBA and reached up to 54 dBA with the PACs operating.
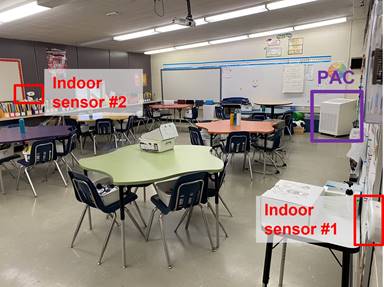
Figure 1. A PAC unit and 2 indoor air quality sensors in a classroom.
Figure 2 shows the outdoor and indoor CO₂ concentrations in a classroom in the intervention school (INT) from the last week of March to June 2023 (14 weeks). The last of week of March (week 1) was spring break. It can be observed from Figure 2 that the indoor CO₂ concentrations were primarily dependent on the presence of occupants. It is worth noting that the details about the HVAC system’s operating schedule, the outdoor air intake rate, the in-duct filter efficiency, and the air infiltration through building envelopes were unknown in these classrooms. Additionally, a PAC was installed in this classroom at the end of week 6 and was subsequently operated continuously, which, as expected, did not affect the CO₂ concentrations in both classrooms.
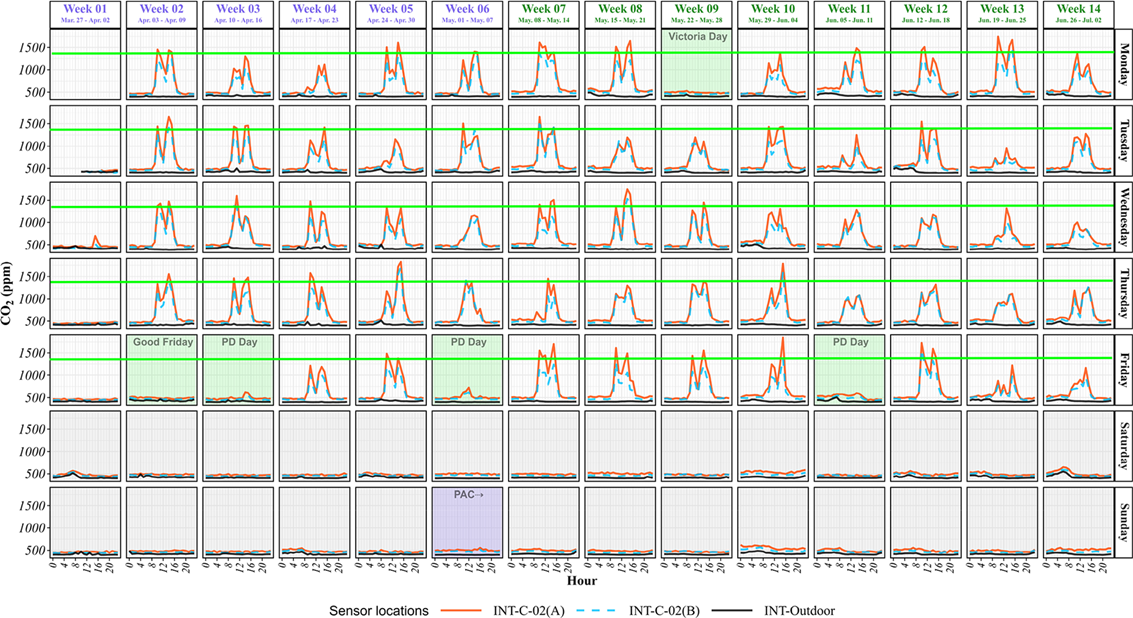
Figure 2. Outdoor and indoor CO₂ concentrations in an intervention school classroom (INT-C-02): March -June
The CO₂ concentrations in two adjacent classrooms, INT-C-02 and INT-C-03, in the intervention school on April 11 and May 16 are plotted in Figure 3. These classrooms have similar layouts, dimensions, and HVAC system configurations. INT-C-02 had 29 students (ages 11 to 12), whereas INT-C-03 had 20 students (ages 13 to 14). The higher occupant density in INT-C-02 resulted in higher CO₂ concentrations than the levels observed in INT-C-03 during occupied hours. The CO₂ concentrations measured from both schools were generally lower than the levels (denoted by the green lines in Figure 2 and Figure 3) calculated by Persily (2022) for classrooms based on occupant characteristics and ASHRAE 62.1 ventilation requirements, indicating sufficient ventilation rates in the classrooms.
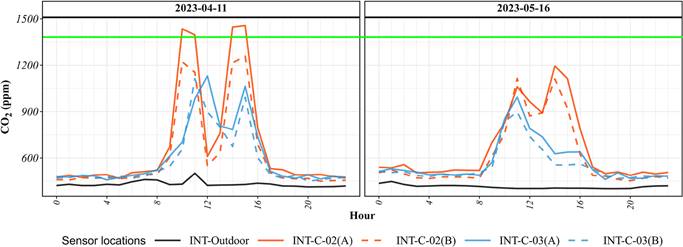
Figure 3. CO₂ concentrations in 2 classrooms in the intervention school on April 11 and May 16.
Outdoor PM 2.5 and PM₁ concentration
Figure 4 presents the measured indoor and outdoor PM2.5 concentrations in two classrooms during the 14-week testing period from March to June. One classroom is in the intervention school (INT), identified as INT-C-10, and the other in the control school (CTL), CTL-C-10. The results between weeks 7 and 12 demonstrate that the outdoor sources contributed the most to the indoor PM2.5 concentrations during this period. The higher than usual outdoor particle concentrations during this period were likely correlated to the wildfire events in the province of Alberta at that time (Wikipedia, 2024). No PACs were used in either school between week 1 and week 6, and no increase in the concentrations of PM2.5 was observed in either classroom during the occupied period between 8 AM and 4 PM. Indoor and outdoor PM₁ data showed a similar pattern.
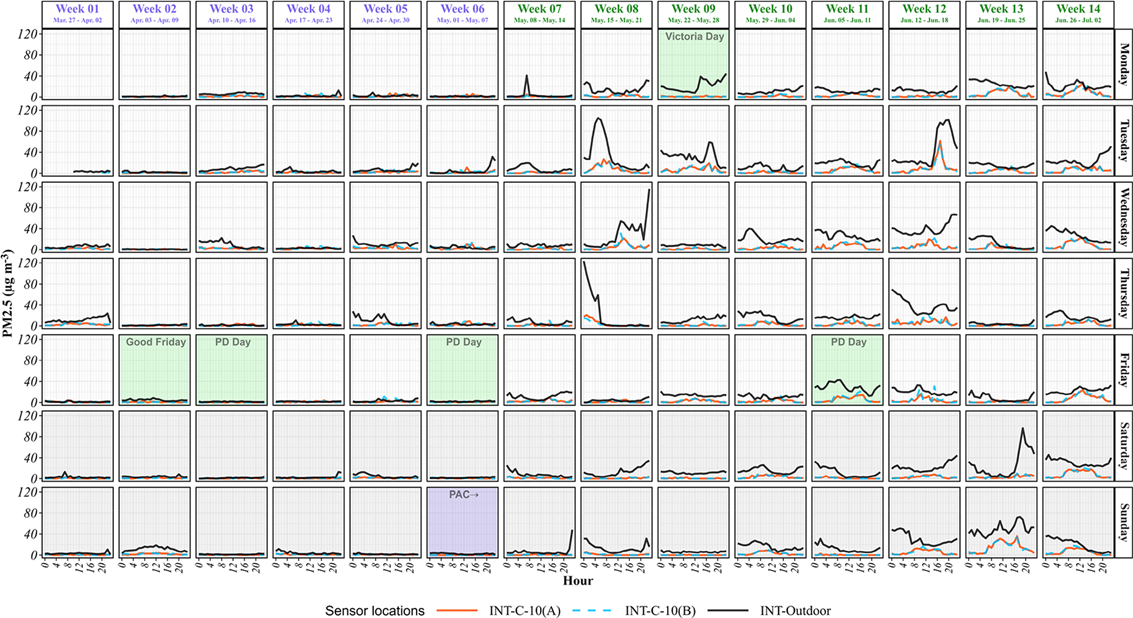
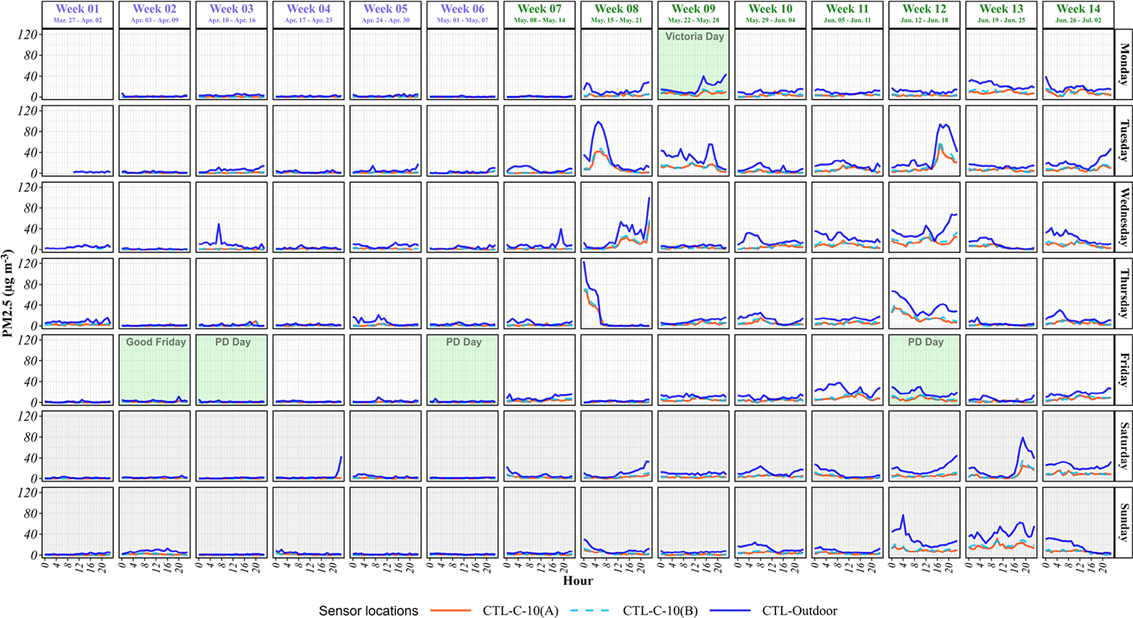
Figure 4. PM2.5 concentrations: a classroom in the intervention school (above) and in the control school (below).
Operation of PACs
The PM₁ concentrations in two classrooms, INT-C-09 and INT-C-10, in the intervention school on April 11 and May 16 are plotted in Figure 5. These two classrooms have the same layouts, dimensions, and HVAC system configurations. Neither room has exterior walls or windows. The PAC in INT-C-09 was controlled by a timer to operate between 8 AM and 5 PM, whereas the PAC in INT-C-10 was operating continuously. A comparison between the PM₁ concentrations measured in the two rooms demonstrated that the operation of the PAC between 2 and 8 AM in INT-C-10 reduced the indoor PM₁ concentration during the period when high levels of outdoor PM₁ were present.
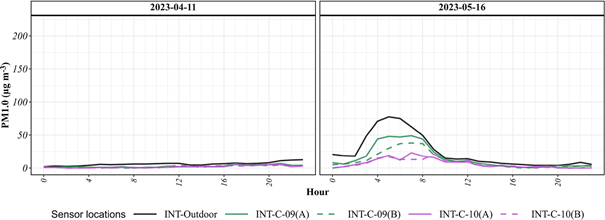
Figure 5. Effect of intermittent operation of PAC on indoor PM₁.
The test results presented so far demonstrate that the outdoor sources contributed the most to the indoor PM₁ and PM2.5 concentrations in both the control and the intervention schools. During the study period, the outdoor particle concentrations were consistently higher than the indoor particle concentrations. In the control school, particle ingress from outdoor sources was reduced by the HVAC system in-duct filters and the building envelope. In the intervention school, particles from outdoor sources were further removed by the HEPA filters in the PAC units after May 6, 2023. A particle removal efficiency index (equation below) can be used to assess the effectiveness of filtration in removing particles when the sources of particulate matter are dominated by outdoor sources.
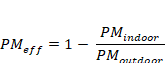
Table 1 presents the average PM₁ and PM2.5 concentrations and removal efficiencies calculated for two classrooms from each school on April 11 and May 16. An air quality alert due to wildfire smoke spreading from the province of Alberta was issued for Winnipeg on May 16, 2023, responsible for the rise in the outdoor PM₁ and PM2.5 concentrations. The PAC units operated continuously in the two classrooms in the intervention school after they were deployed.
Table 1. PM₁ and PM2.5 concentration and removal efficiency.
School | Date | PAC (Y/N) | Outdoor PM₁ conc (µg/m³) | Indoor PM₁ conc (µg/m³) | Outdoor PM2.5 conc (µg/m³) | Indoor PM2.5 conc (µg/m³) | PM₁ removal efficiency | PM2.5 removal efficiency |
Control | April 11 | N | 4.53 | 1.54 | 6.70 | 1.70 | 0.66 | 0.74 |
Control | May 16 | N | 22.07 | 14.97 | 32.11 | 15.55 | 0.29 | 0.48 |
Intervention | April 11 | N | 6.22 | 2.16 | 8.81 | 2.31 | 0.65 | 0.74 |
Intervention | May 16 | Y | 24.65 | 9.26 | 34.07 | 9.69 | 0.61 | 0.70 |
Figure 4 and Figure 5 illustrate that the outdoor concentrations of PM2.5 and PM₁ on May 16 were much higher than those on April 11. The elevated outdoor particle concentrations on May 16 resulted in much lower PM₁ and PM2.5 removal efficiencies than those on April 11, as shown in Table 1. On April 11, no PAC units were used in either school. On May 16, PAC units were used in the intervention school. Table 1 shows more pronounced decreases in particle removal efficiencies (both PM₁ and PM2.5) between these two days in the control school, compared to the intervention school. Considering all these factors, the PAC units appear to remove some of the particles that infiltrated indoors. To quantitatively determine the removal efficiency of the PAC units for indoor particulate sources, comparative tests need to be carried out when the outdoor particle concentration remains reasonably constant.
It is worth noting that the design limit of PM2.5 in ASHRAE 62.1 (ASHRAE, 2022) is 12 μg/m³, which is the annual standard for PM2.5 averaged over three years defined by the US Environmental Protection Agency.
The results generated by this study in two schools will be of interest to users, practitioners, and manufacturers when considering improving ventilation and using PACs in public spaces to improve indoor air quality. First, the indoor CO₂ concentrations measured in both schools were dependent on the presence of occupants and the leaks/openings through the building envelope in the space. The CO₂ concentrations measured in both schools indicated that the ventilation rates in the classrooms were generally sufficient. Additionally, the outdoor particle sources were the most significant contributor to the indoor particle concentrations. The increase in outdoor particle concentrations in the latter part of the study period was caused by wildfire events in a nearby province. Furthermore, the PAC units in the intervention school were able to remove some of the ambient particles that infiltrated indoors. Another interesting observation was that multiple teachers from the intervention school commented that the noise and draft created by the PAC units were pleasant. The draft was particularly nice during hot summer days.
The observations above indicate that CO₂ concentration can be used to control ventilation for using outdoor air to dilute indoor air contaminants, particularly those generated by occupants, whereas outdoor and indoor particle measurements can be used to determine the needs for ventilation, filtration, and air cleaning. Further research is required to better understand how particle measurements can be used to control ventilation and air cleaning systems.
One limitation of the current study is the lack of details about the HVAC system’s operating schedule, the outdoor air intake rate, the in-duct filter efficiency, and the air infiltration through building envelopes in both the control and intervention schools. In the next phase of the study, efforts will be made to examine the sick days reported in both schools, virus sampling from indoor air and surfaces, ventilation rate (e.g. CO₂ decay after occupancy or other tracer gas methods), PAC airflow rates, building envelope airtightness, in-duct filter efficiency, and PAC filter efficiency, etc. The goals are to verify the cost and effectiveness of air cleaning and ventilation measures and to quantify the impact of engineering measures on building occupants’ health.
This work is supported by the federal government of Canada’s Addressing Air Pollution Horizontal Initiative and the NRC International’s Eureka Network project “Reducing the risk of viral contagion from the airborne transmission of pathogens within building spaces”.
ASHRAE. (2022) ANSI/ASHRAE Standard 62.1, Ventilation and Acceptable Indoor Air Quality. Peachtree Corners, GA: ASHRAE.
Black, C., Tesfaigzi, Y., Bassein, J. A., and Miller, L. A. (2017) Wildfire Smoke Exposure and Human Health: Significant Gaps in Research for a Growing Public Health Issue. Environ Toxicol Pharmacol., 55: 186–195.
CDC. (2021). Ventilation in buildings, Centers for Disease Control and Prevention, www.cdc.gov/coronavirus/2019-ncov/community/ventilation.html.
EMG/SPI-B. (2021). Application of CO₂ monitoring as an approach to managing ventilation to mitigate SARS-CoV-2 transmission, Environmental Modelling Group (EMG) and Scientific Pandemic Insights Group on Behaviours (SPI-B).
ECCC. (2023). Wildfire smoke, air quality and your health. Environment and Climate Change Canada.
Fennelly, K. (2020). Particle sizes of infectious aerosols: implications for infection control, Lancet Respir. Med. 8, 914–924.
Persily, A. (2022) Development and application of an indoor carbon dioxide metric. Indoor Air, Volume 32, Issue 7.
REHVA (2021). REHVA COVID-19 Guidance, version 4.1, Federation of European Heating, Ventilation and Air Conditioning Associations.
Wang, C. C., Prather, K. A., Sznitman, J., Jimenez, J. L., Lakdawala, S. S., Tufekci, Z., and Marr, L. C. (2021). Airborne transmission of respiratory viruses. Science, 373(6558), abd9149.
Wikipedia. (2024). 2023 Canadian wildfires. Retrieved April, 2024, from https://en.wikipedia.org/wiki/2023_Canadian_wildfires#Alberta
Zhou, L. G., Shu, C., Berquist, J., Gaskin, J., and Nilsson, G. (2023). Impact and benefits of the air cleaning measures implemented in two schools. Air Infiltration and Ventilation Centre. Copenhagen, Denmark.
Follow us on social media accounts to stay up to date with REHVA actualities
0